Some new perspectives on the 2018 A level results: STEM gap remains but decline in foreign languages exaggerated
This blog has been Kindly provided to HEPI by Mary Curnock Cook, Senior Advisor, Cairneagle Associates, as well as a HEPI Advisory Board member and a former CEO of UCAS.
Background
Aggregate data on A level results are released by the Joint Council for Qualifications (JCQ), the umbrella body for the main exam boards in the UK. In a 49-page pdf file (with no available csv version), results are broken down by subject and by UK country as well as by gender. But like other data sources, such as the excellent data explorer from Education DataLab, https://results.ffteducationdatalab.org.uk/a-level.php, the JCQ data gives us numbers of entries which, without the underlying population data, make it difficult to ascertain the trends in subject preferences.
The JCQ press release mentions a 3.5% fall in the population which is probably an over-estimate. More carefully curated data to match exactly the school year and month of birth (which is pertinent to the school year of the student) estimate the population drop to be closer to 2.5%. In this note, we use proportion of total entries to look at trends. While this won’t account for any increase in the participation rate in A levels, it starts to provide a more useful measure of trends and preferences than simply plotting changes in the numbers of candidates.
Without having the data at individual candidate level, it’s impossible to ascertain the trends in subject combinations which would make interesting reading, especially following the move from AS/A2 to linear structures for many subjects. The JCQ could and should do much more to analyse the data it hosts from the exam boards – the gruesome pdfs, which have been released in the same prehistoric format for years, are a big frustration for anyone trying to find out what’s really happening.
The headlines
The JCQ press release picks out the following highlights:
- a steady national picture with outcomes relatively unchanged as reformed qualifications continue to be introduced;
- at A level, A* down 0.3 percentage points to 8.0%, A*-A up 0.1 percentage points to 26.4% and A*-E down 0.3 percentage points to 97.6%;
- STEM subjects continuing to grow in popularity, especially among females; and
- entry trends in French, German, Spanish continue downwards, while Chinese languages buck the trend.
The steady national picture is as predicted. Ofqual, the exams regulator has made it clear they will use their ‘comparable outcomes’ policy to ensure that any unexpected trends following the recent big syllabus / assessment changes do not disadvantage the ‘guinea pig’ cohort of pupils and teachers.
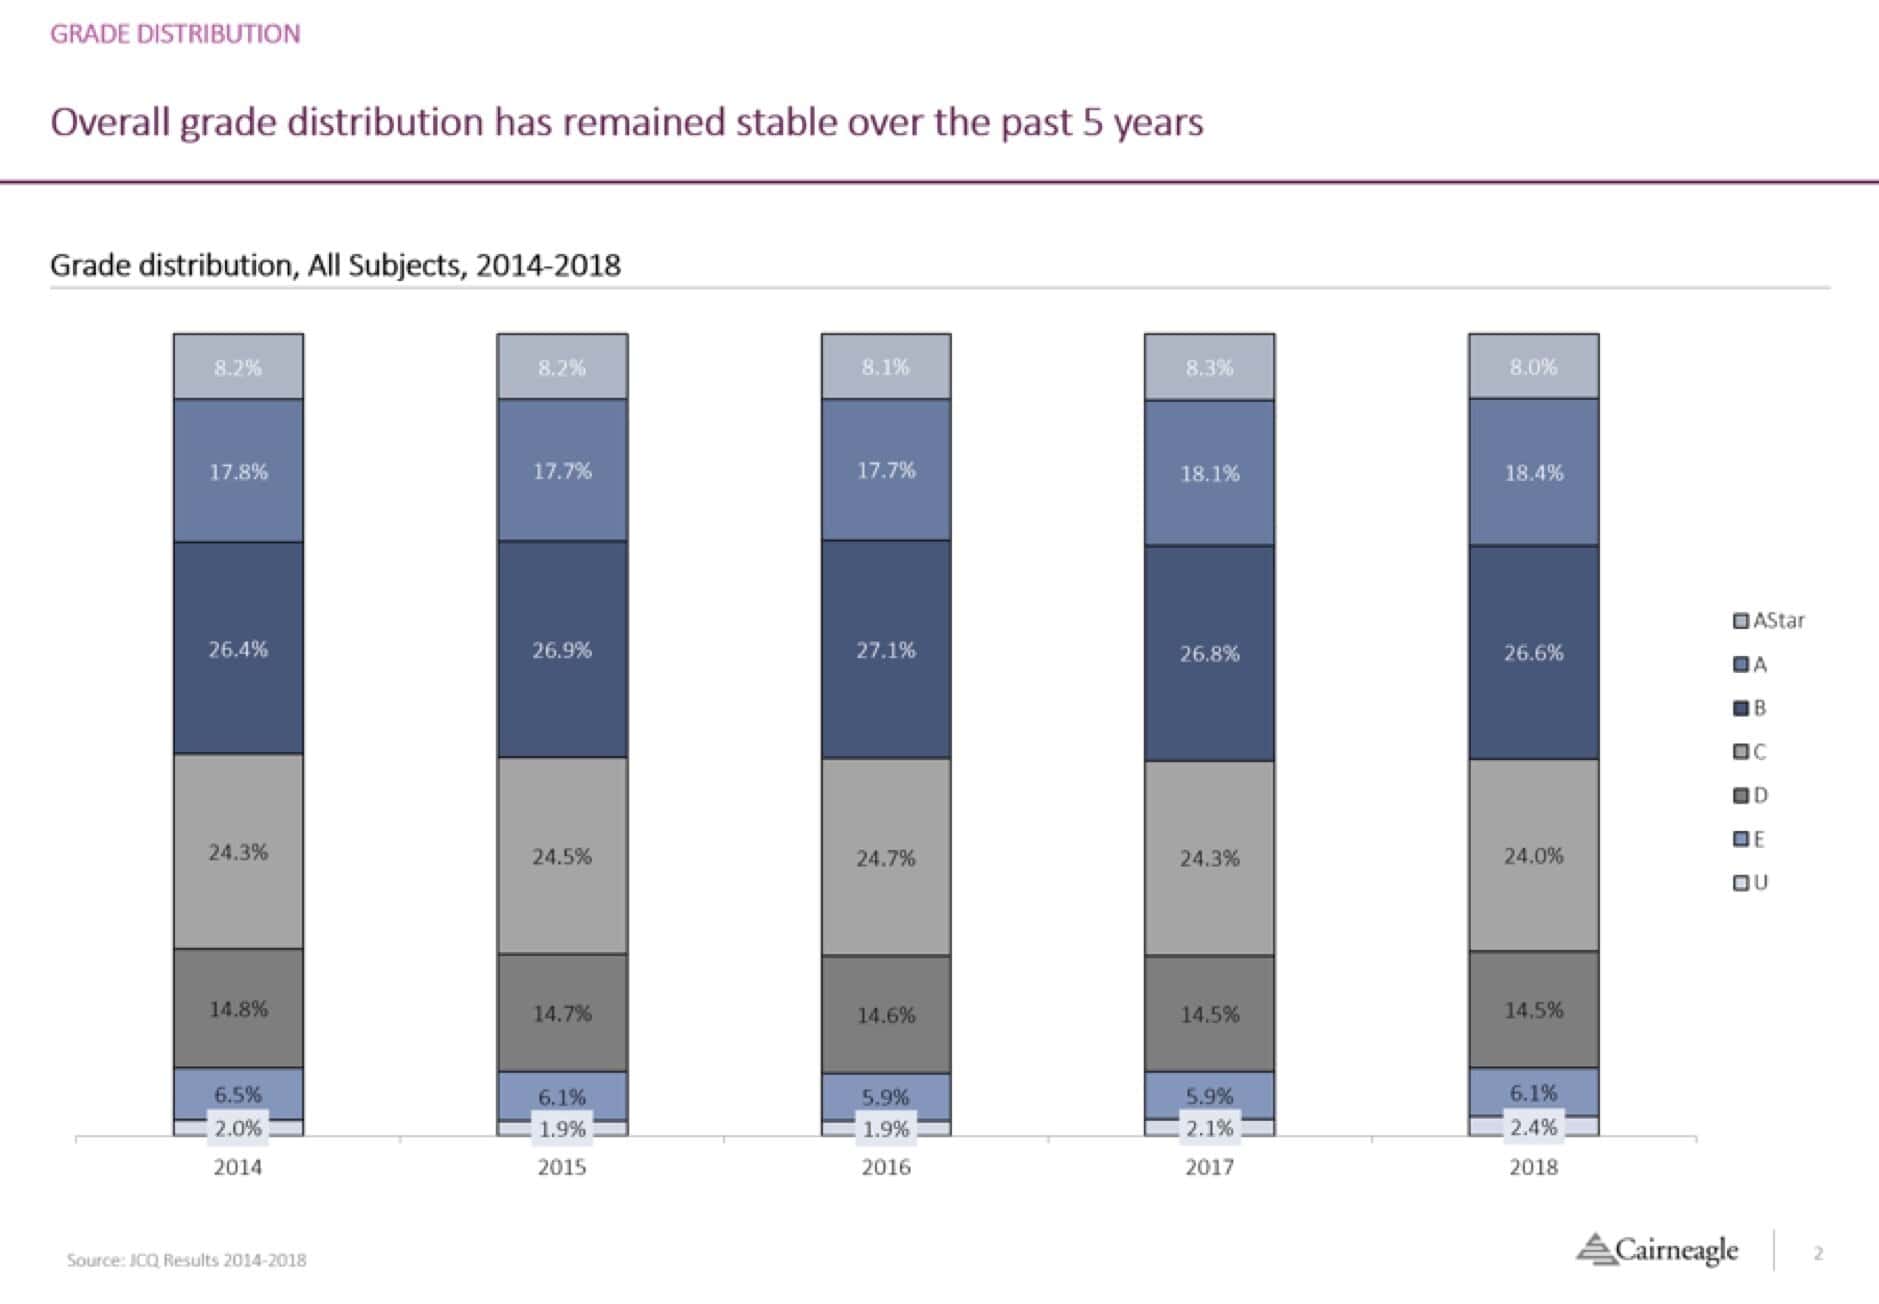
Several newspapers picked up the Telegraph story which pointed out that on some examination papers, students could get an A grade with only half the questions answered correctly. This is what exam boards do: they compensate for harder or easier papers by flexing the grade boundaries so that ‘standards’ stay constant. Add a dose of statistical smoothing and you do indeed get ‘comparable outcomes’. As the chart below shows, and despite seismic changes in the A Level structure and assessment, nothing dramatic has changed in grade distribution over the past five years. Anecdotally, the new ‘tougher’ A levels have indeed been tougher for students, but it seems that their efforts are rewarded with more lenient marking, at least in this first year or two of the new linear A levels.
Grade Distribution
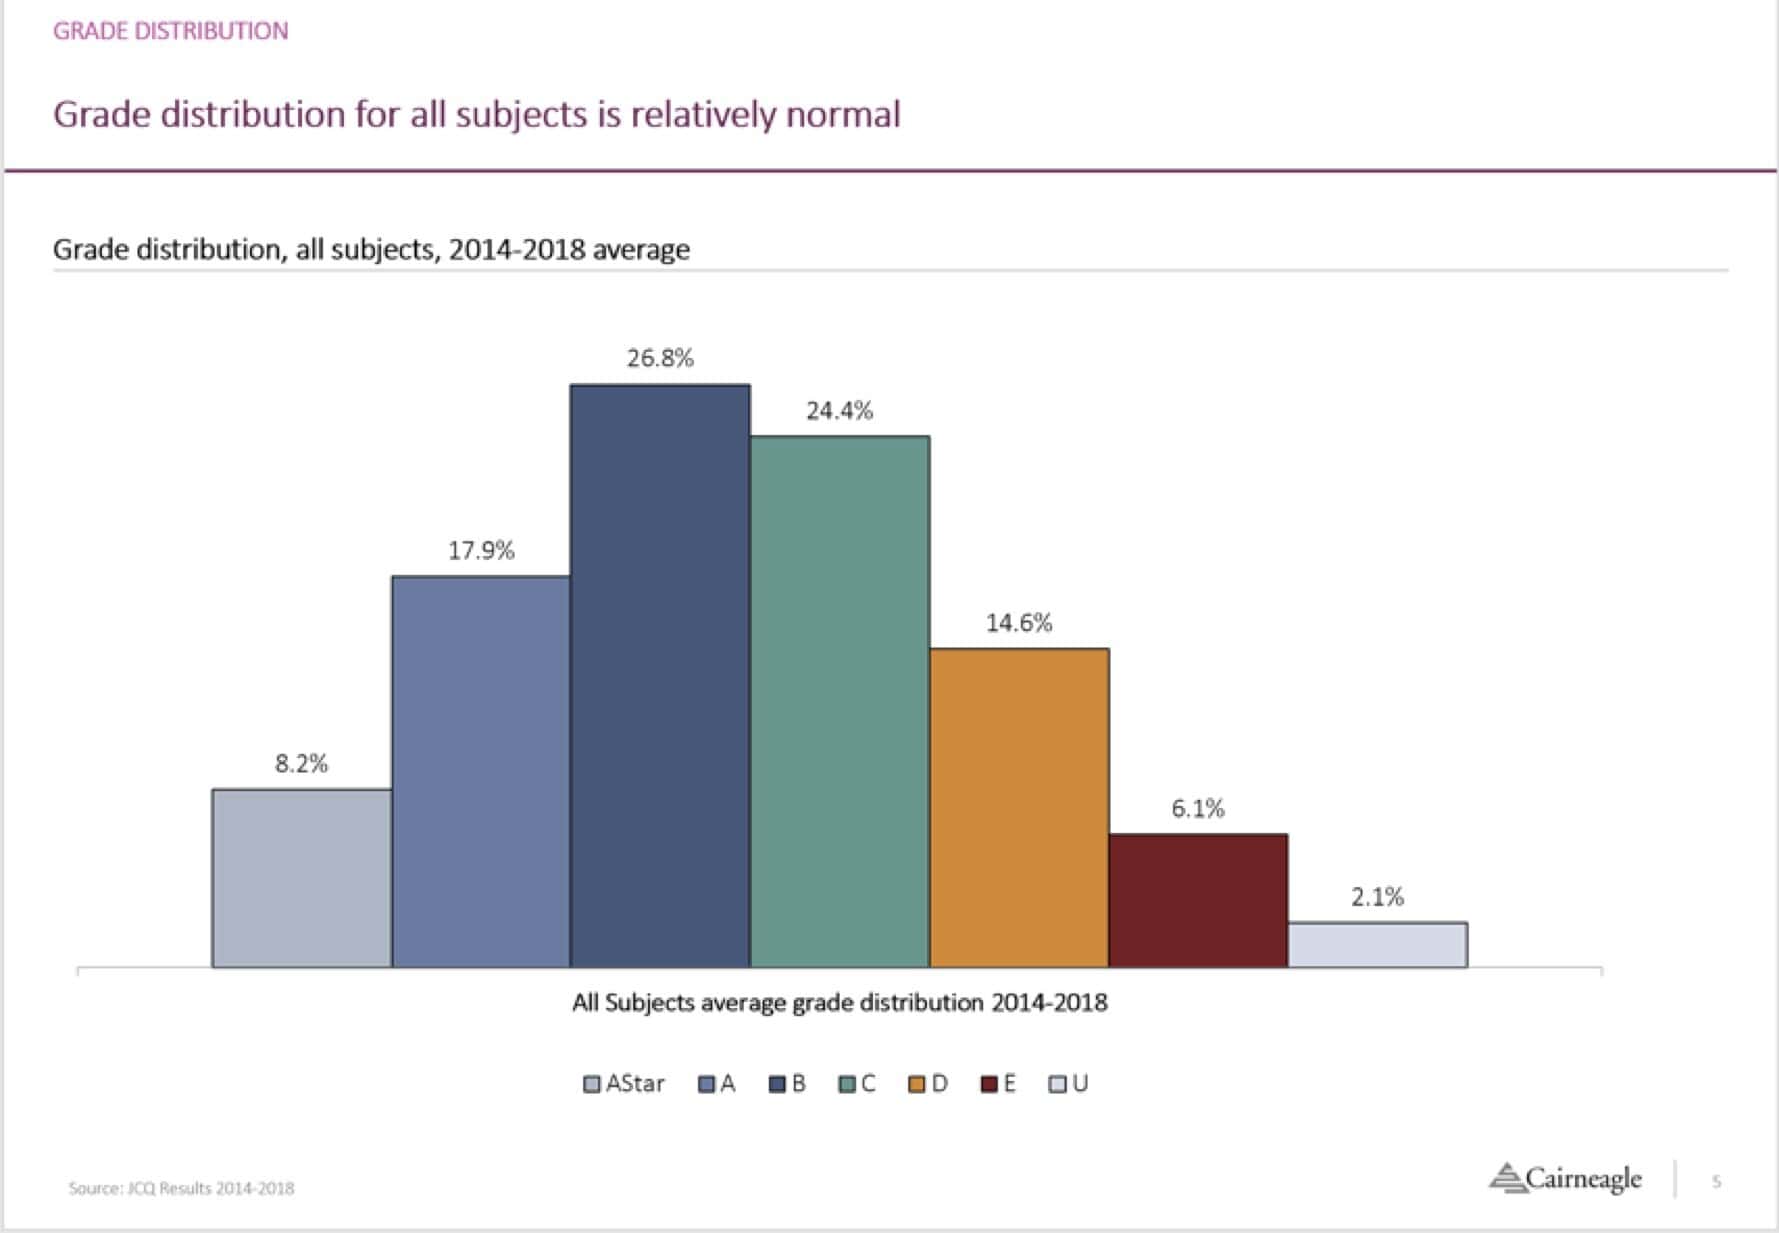
If all is working well with a valid and reliable assessment regime, we might expect a nearly normal distribution of grades. At an aggregate level, this is broadly the case.
It does all get a bit more interesting when you compare grade distribution across different subjects, however. The charts below show how some subjects turn out very different patterns of performance.
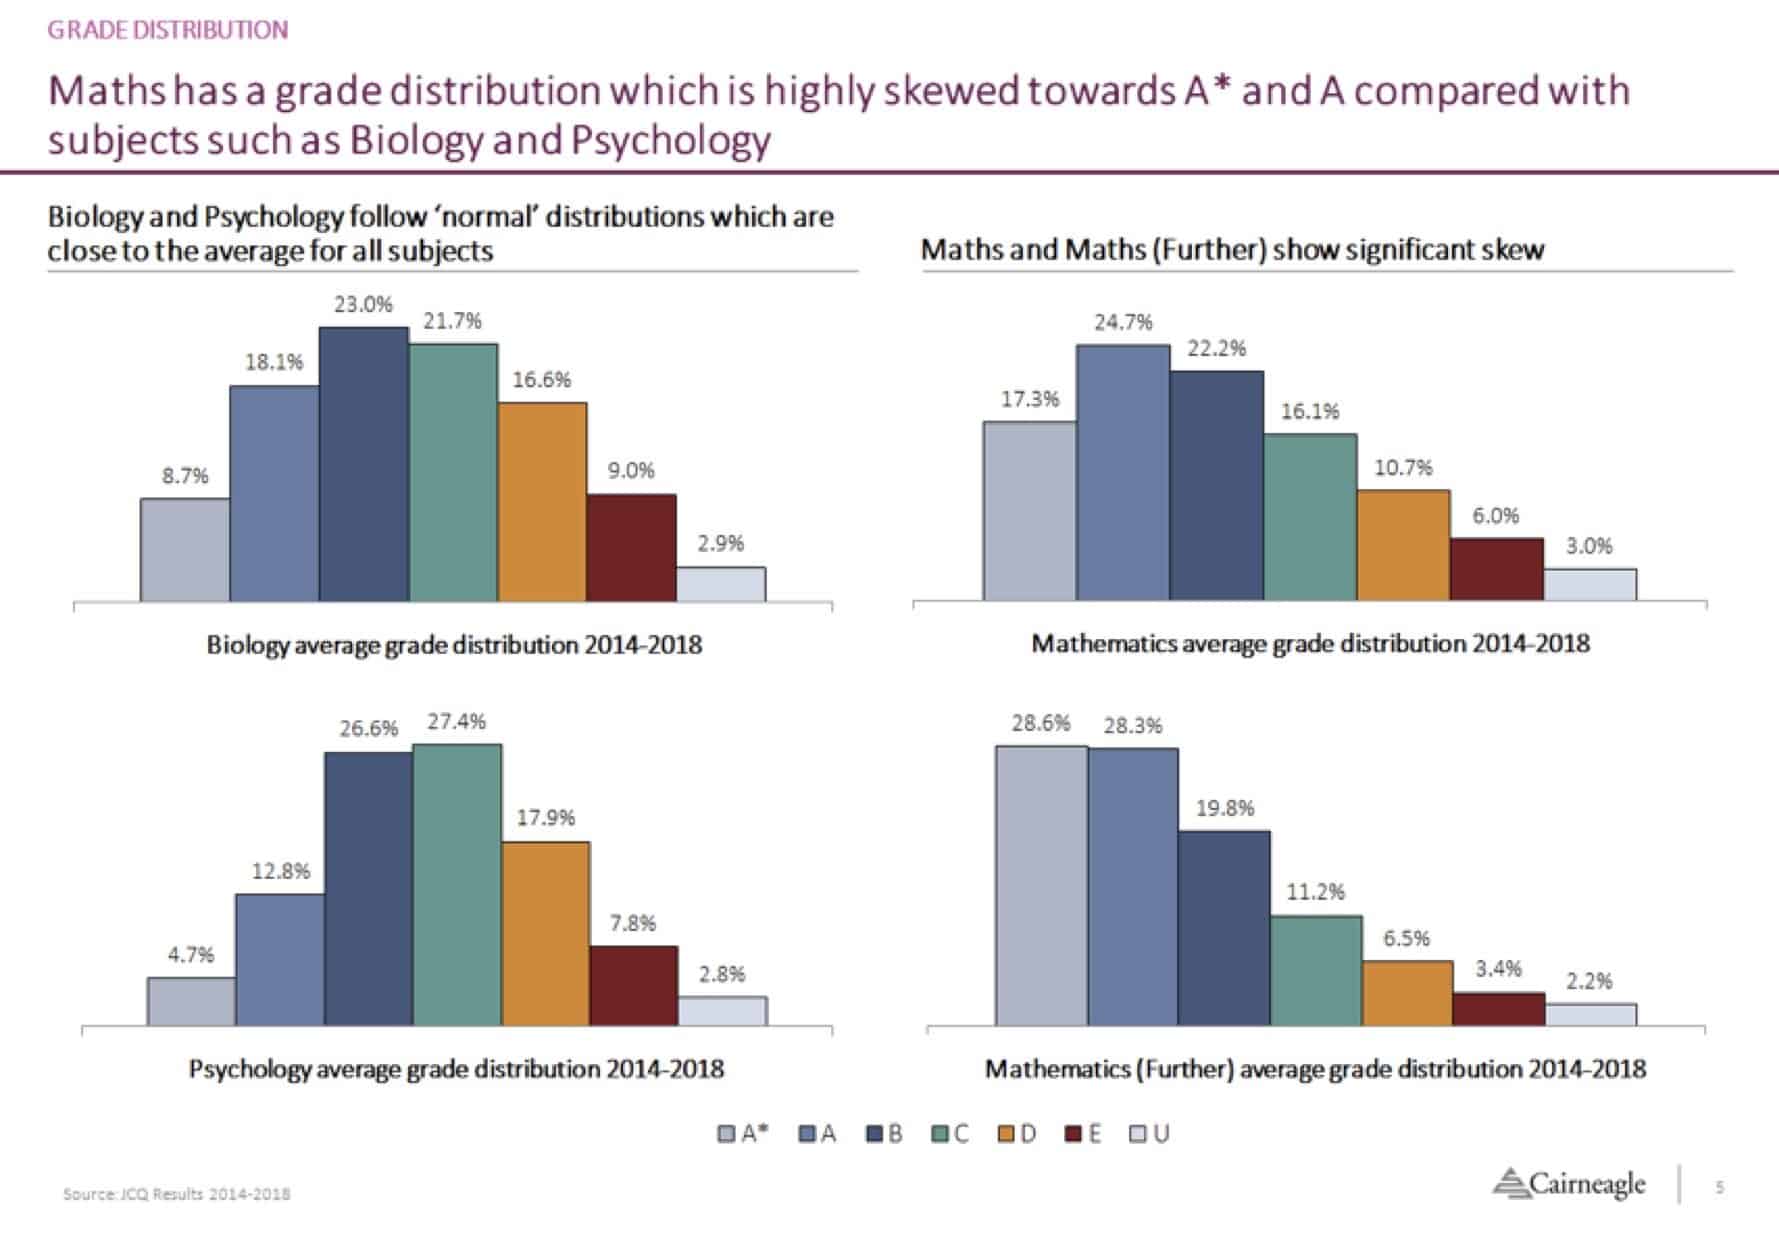
Is it acceptable, or desirable, that over 40% of A level mathematics candidates get A* and A grades – or that in its sister subject, Further Mathematics, nearly 60% score these top grades? We all know that only top-scoring students in mathematics at GCSE (7s, 8s and 9s or A / A* in old money) are likely to be entered for A level and everyone seems to accept that there is a ‘big jump’ in demand between GCSE and A level. But is this right for mathematics education?
Although mathematics is now the most popular A level subject, only one in eight students take it so there’s still an unacceptable proportion of young people who do no mathematics (or even arithmetic) after the age of 16. This shows in poor basic numeracy when they reach university or the workplace. As Dr Harriet Jones, researcher in transitions from secondary to higher education and Biology lecturer at UEA puts it:
I just wish they arrived knowing how to do fractions and percentages.
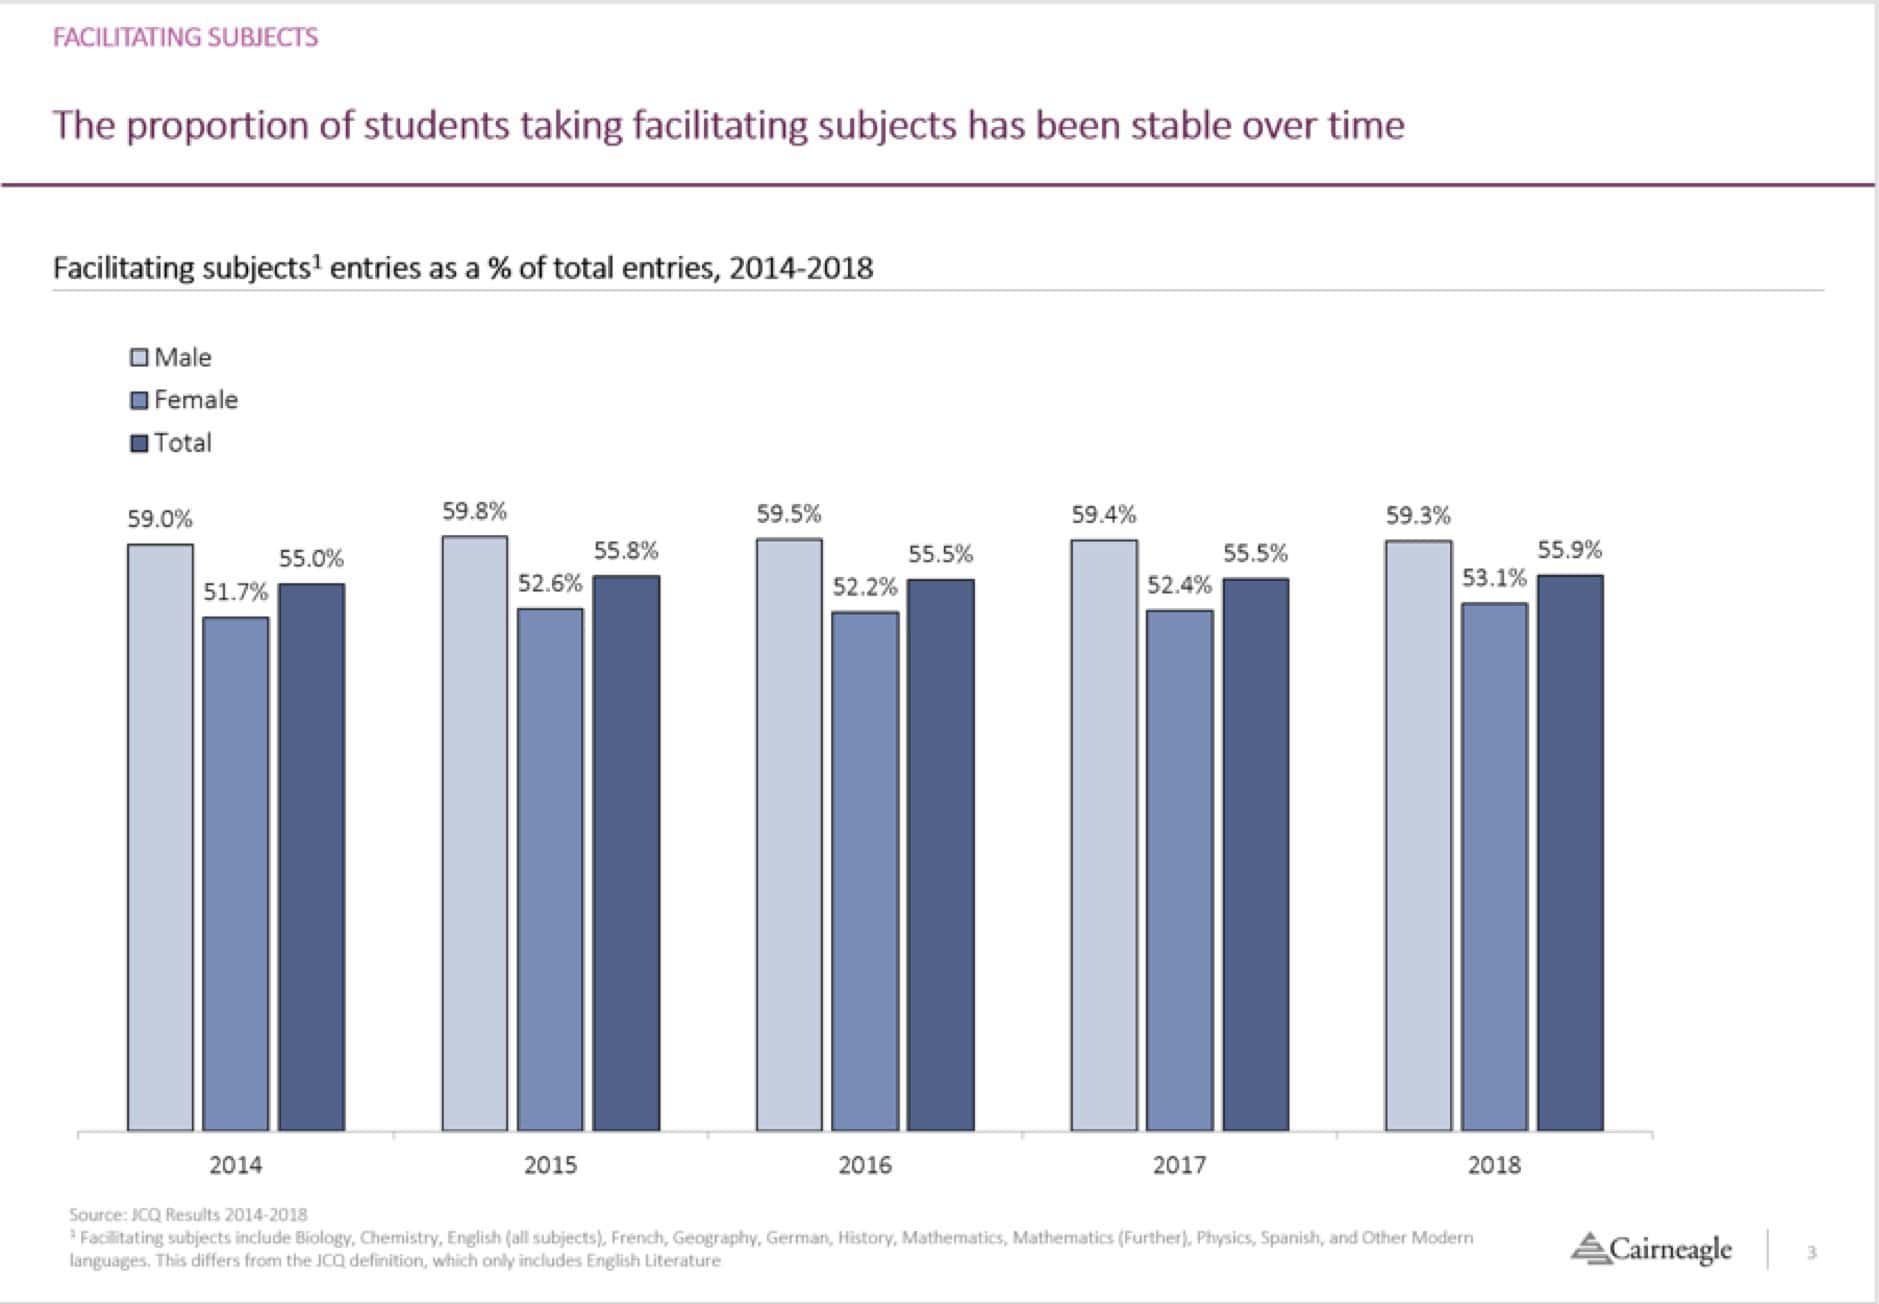
Facilitating Subjects
One of the most influential pieces of guidance for sixth-formers in recent years has been the Russell Group’s Informed Choices guide, first published in 2011. Written in the era before the numbers cap on students was lifted in England, the guide identifies key ‘facilitating subjects’ which will increase the chances of acceptance to a Russell Group course.
Facilitating subjects now make up over half of all A level entries and nearly 60% of male A level entries. This proportion has remained stable over time, with no further skew towards facilitating subjects following the move to linear A levels and students tending to study only three subjects throughout sixth form.
Most popular subjects
The top ten most popular subjects at A level, measured by the share of total entries has barely changed over the past five years.
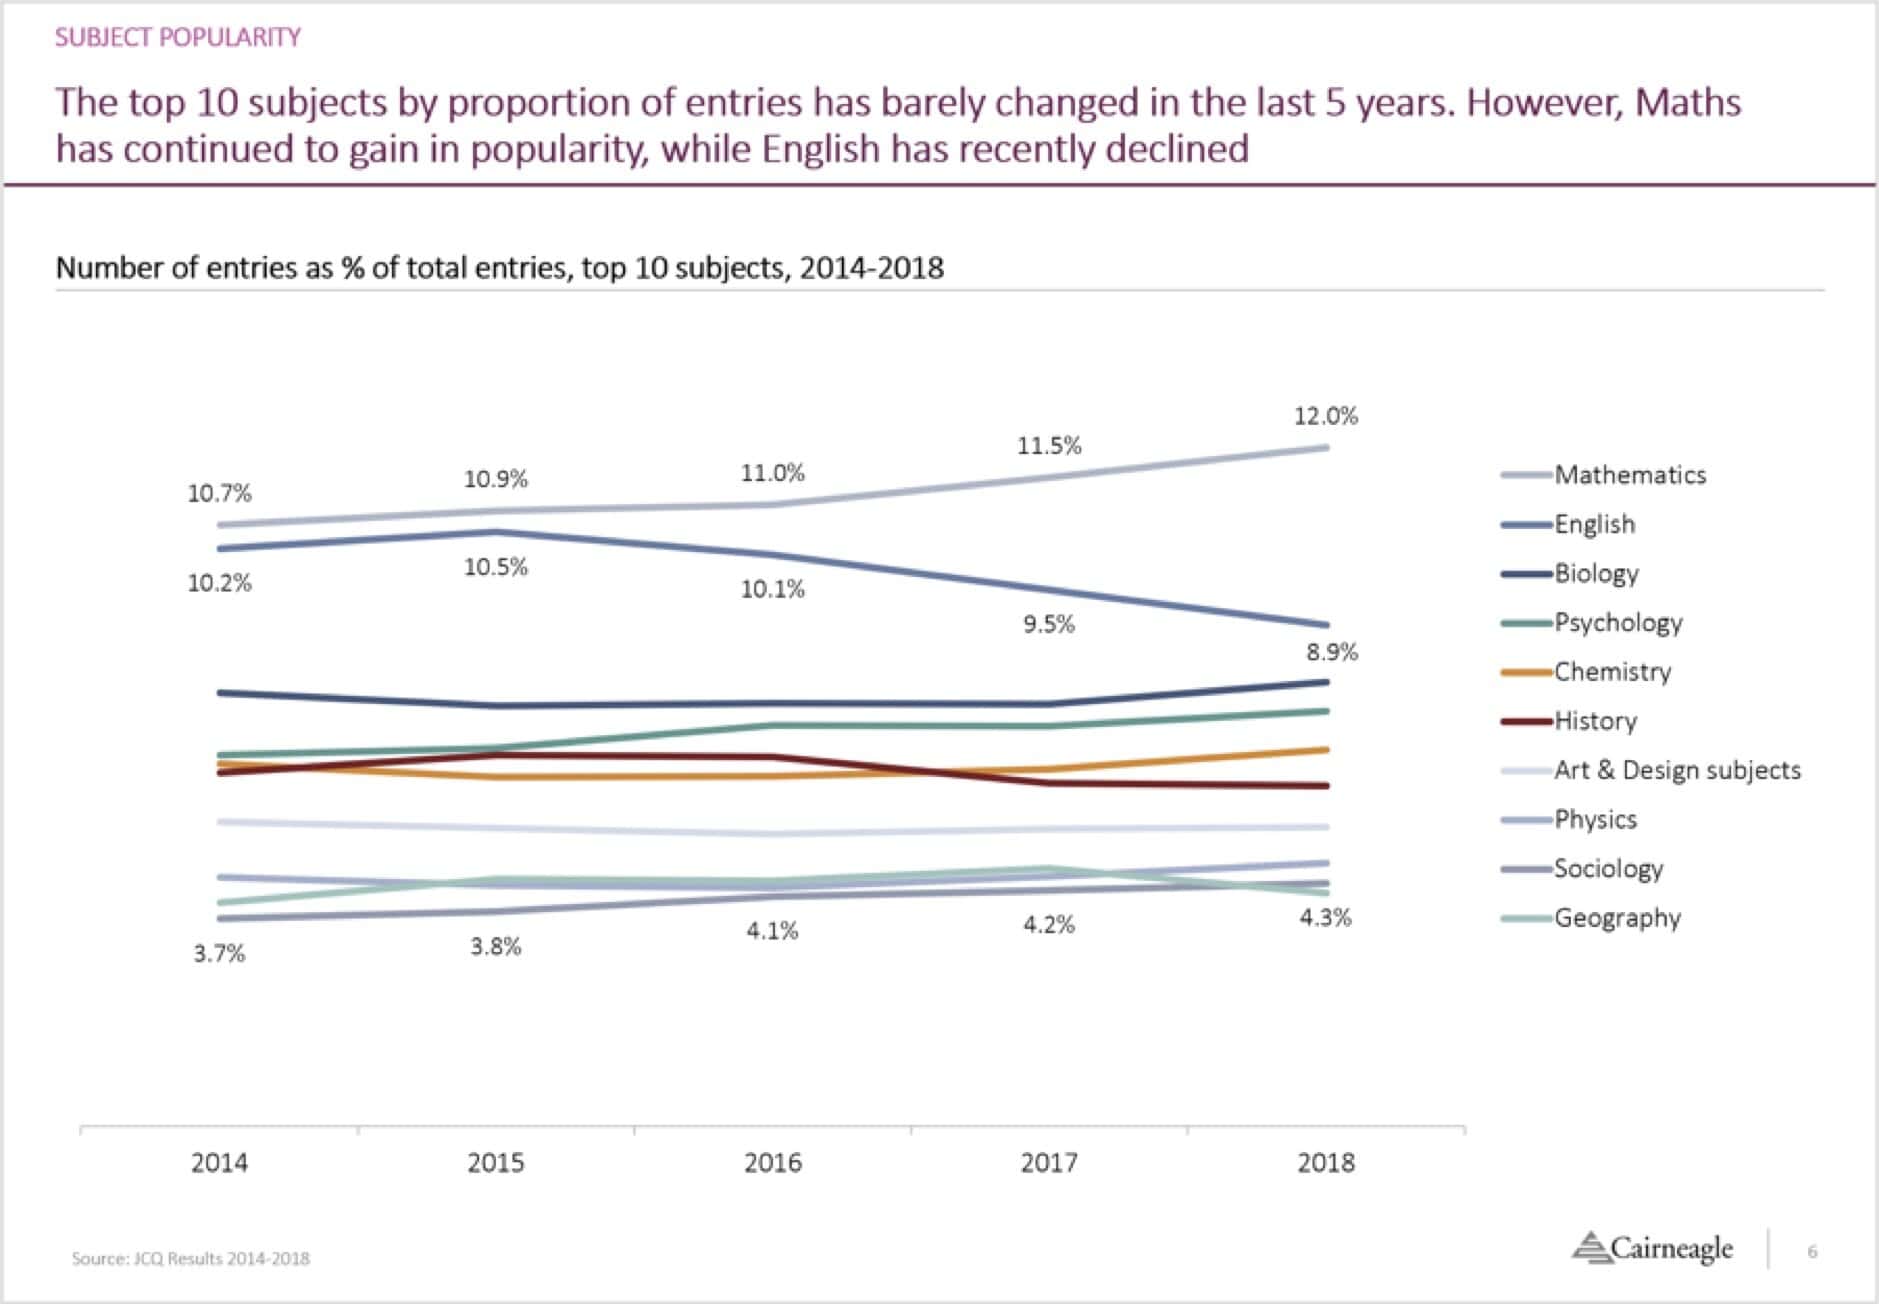
Mathematics is the most popular subject with its share of total entries growing from 10.7% to 12% over the past five years. Meanwhile, English is showing a steep decline, from a share of 10.2% five years ago to 8.9% this year. This decline in English has so far escaped public attention, perhaps because of the changing subject headings in English over time (Note: English includes English Literature, English Language, and English Literature & Language and ‘English’).
Only three of the top ten most popular A level subjects are not facilitating subjects: Psychology, Art and Design, and Sociology.
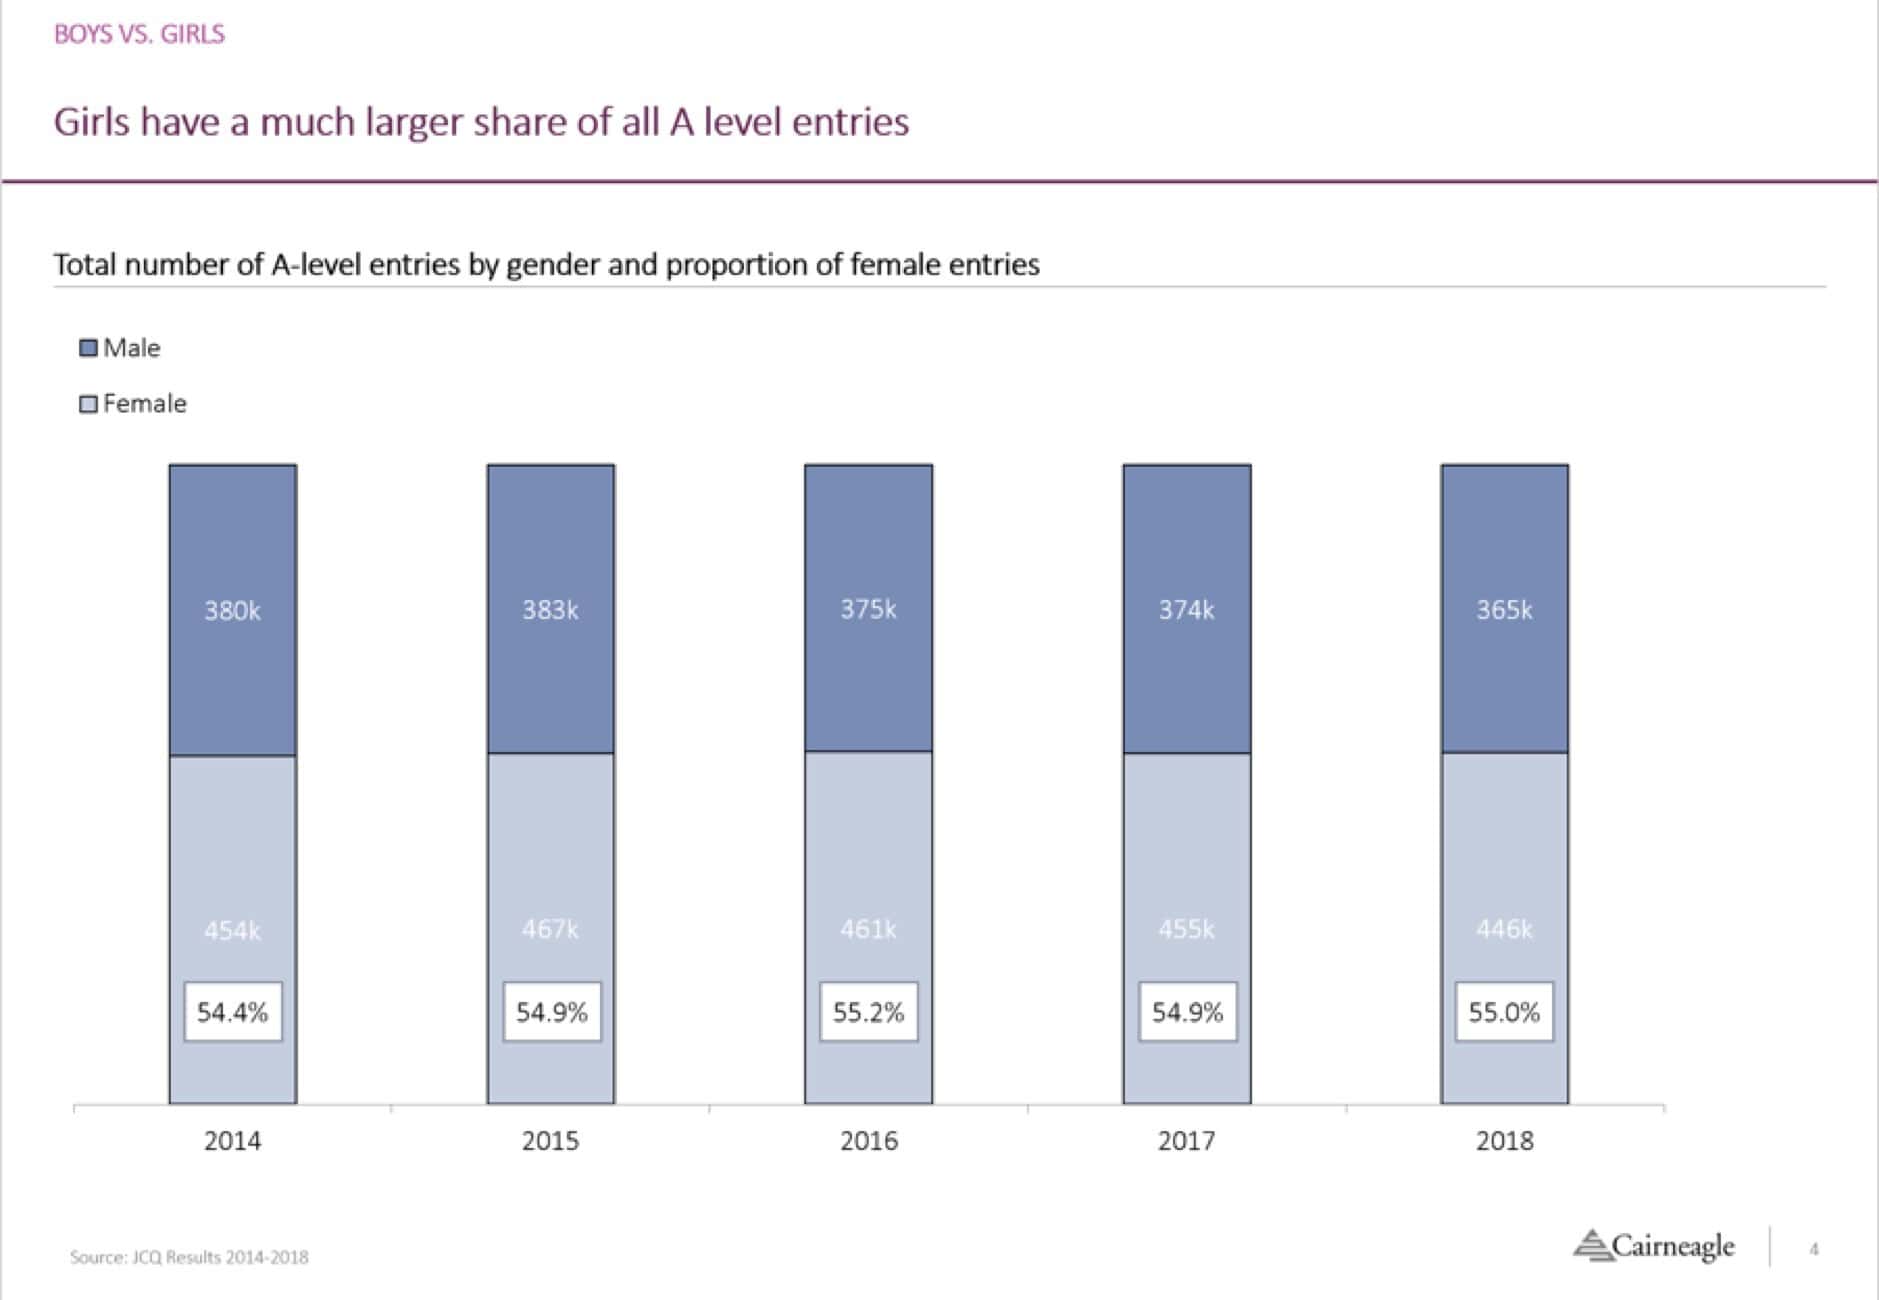
Sex and subjects
The results day headlines that heralded a fractionally better performance by boys at the top A* / A grades hide a much more worrying picture. In 2018, 55% of A level entries were by girls who accounted for 81,000 more of the A level entries than the boys.
Divide by the typical three A level subjects-per-student and you get some 27,000 fewer boys taking A levels. Not surprising that this was almost precisely reflected in the numbers of 18-year olds placed on their university courses on A level results day, where young women outnumbered young men by 26,850. The proportion of A level entries by boys and girls has, however, remained very stable over the past five years, fluctuating between 54% and 55% for girls.
Another favourite for the headlines is the top ten subjects for girls and for boys.
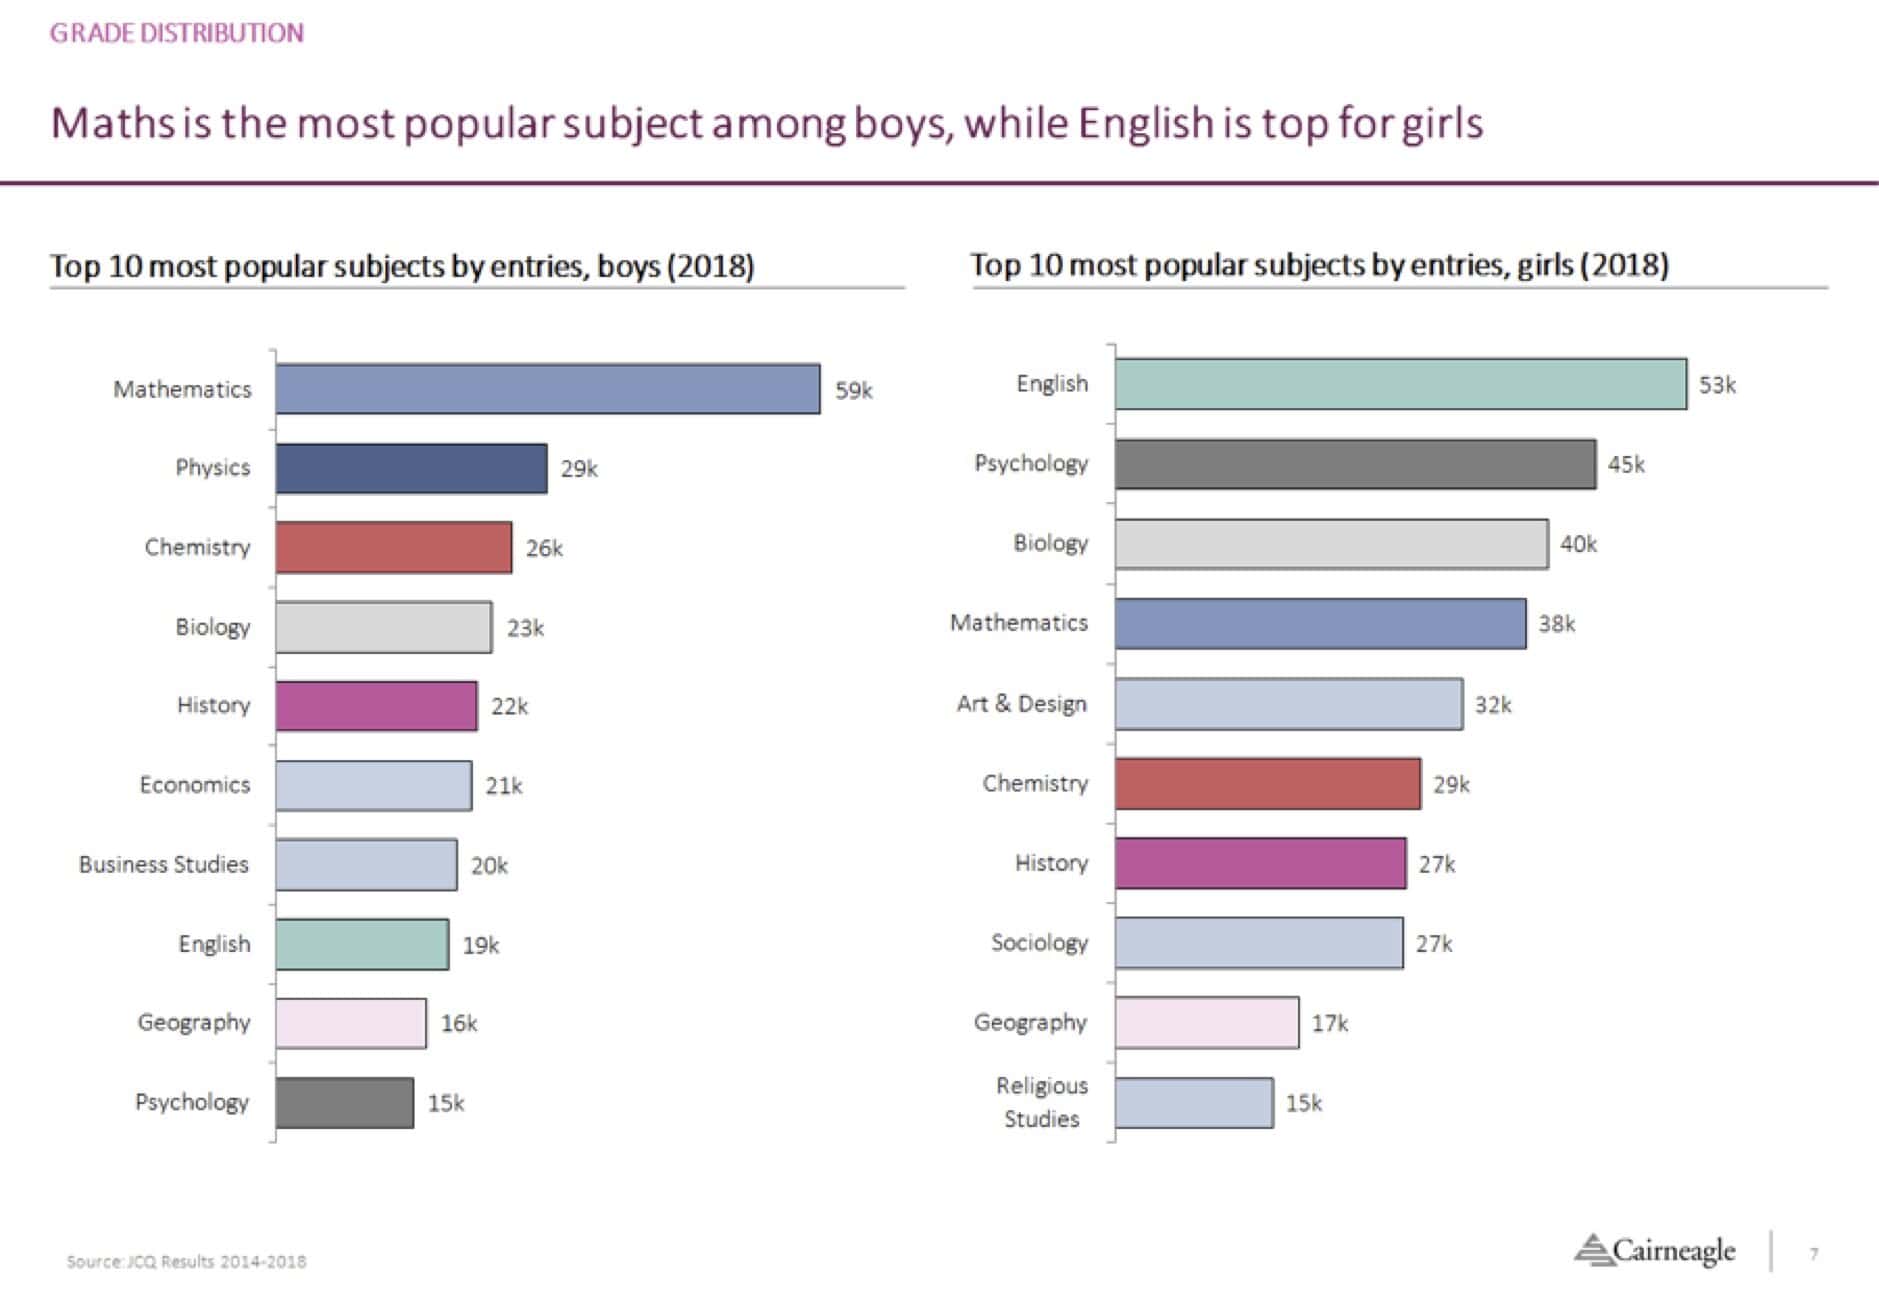
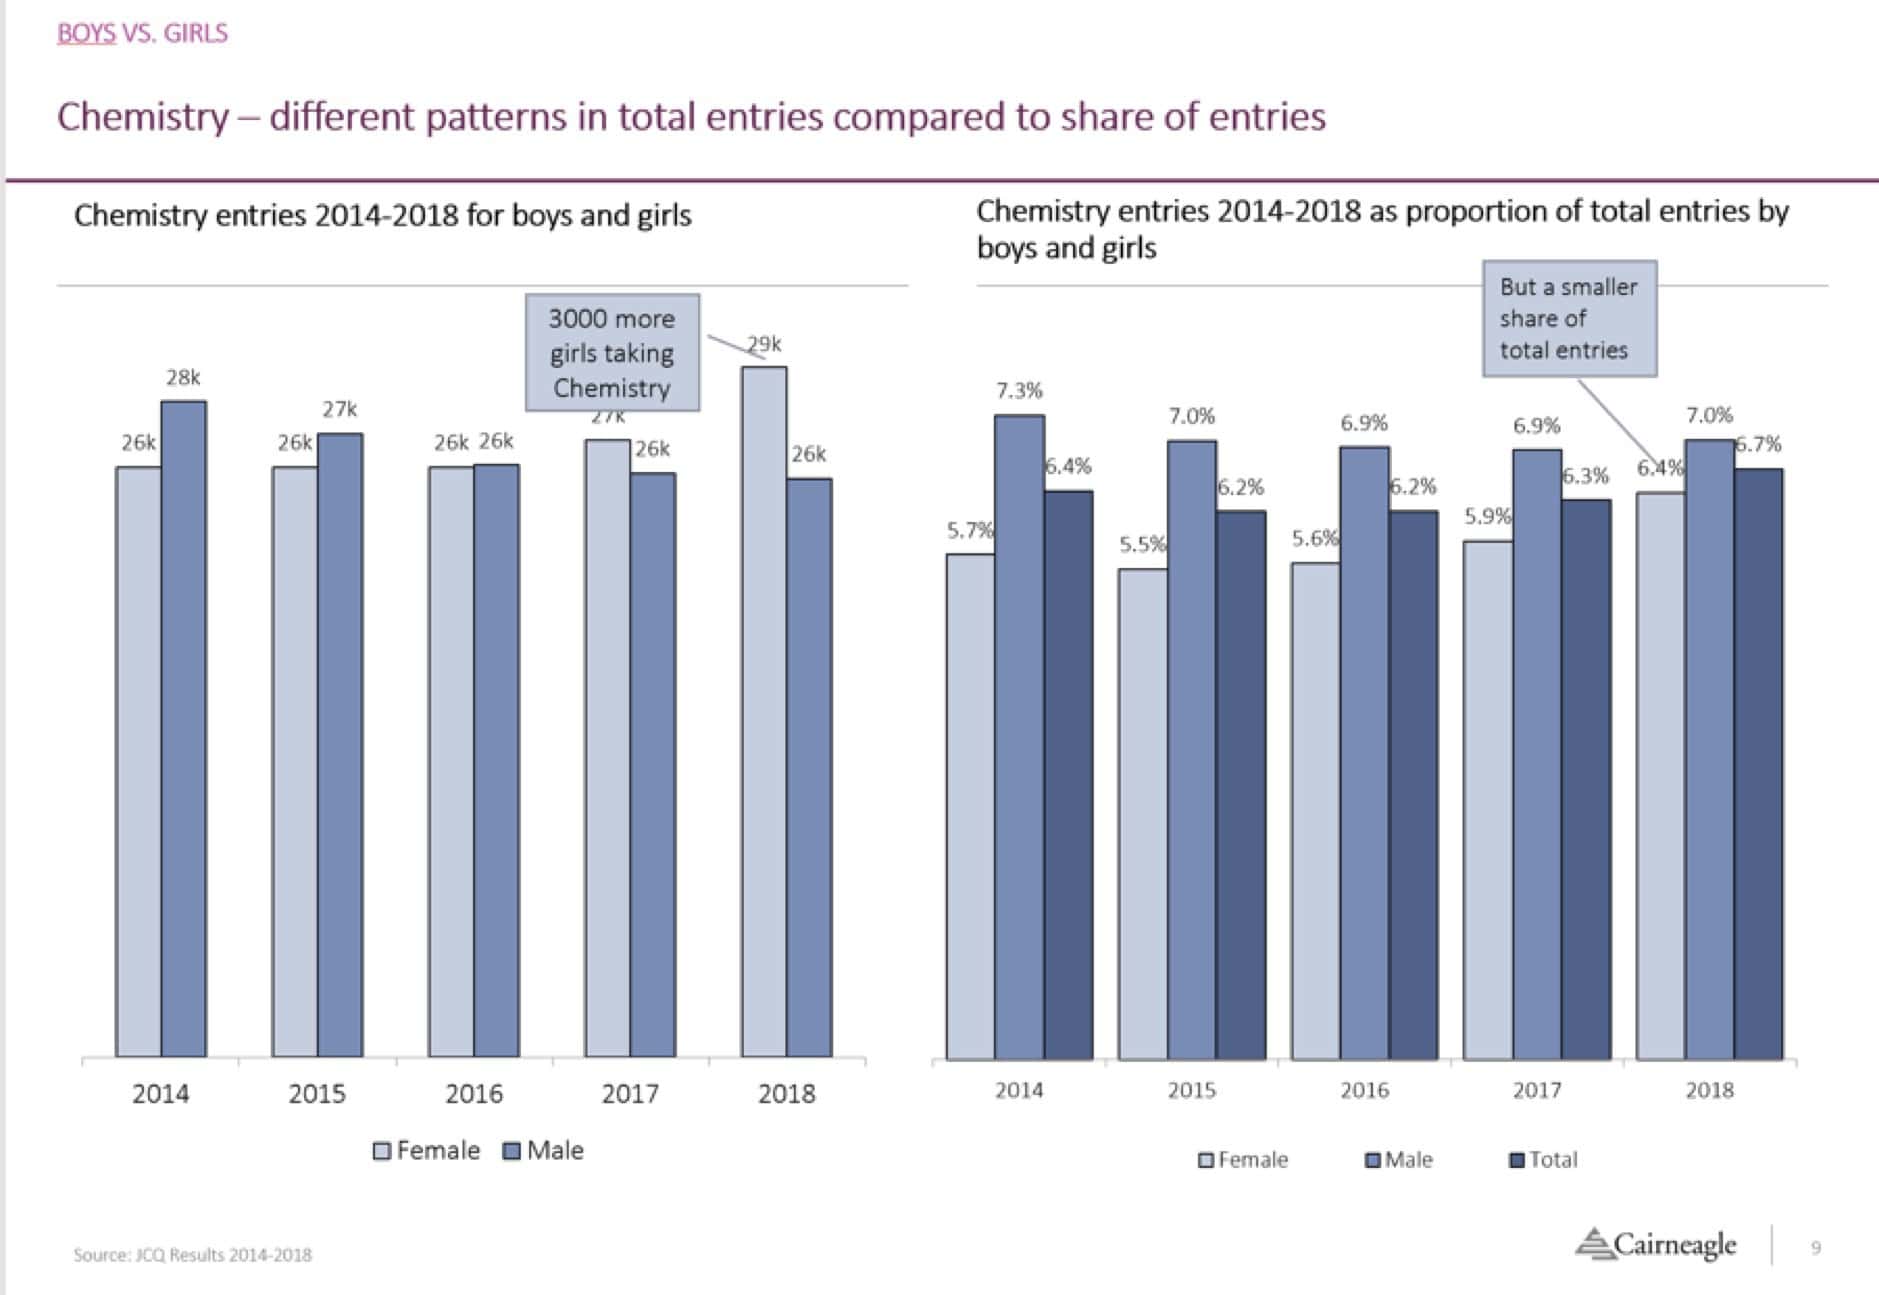
The press was eager to note that girls had overtaken boys in Chemistry this year (29K entry for girls vs 26K for boys). But when we look at the share of entries a different picture emerges. Girls are closing on boys in Chemistry, but they still lag behind in terms of share of entries.
Other growing subject shares for girls include Psychology, Mathematics, Sociology, and Political Studies.
STEM (Science, Technology, Engineering and Mathematics)
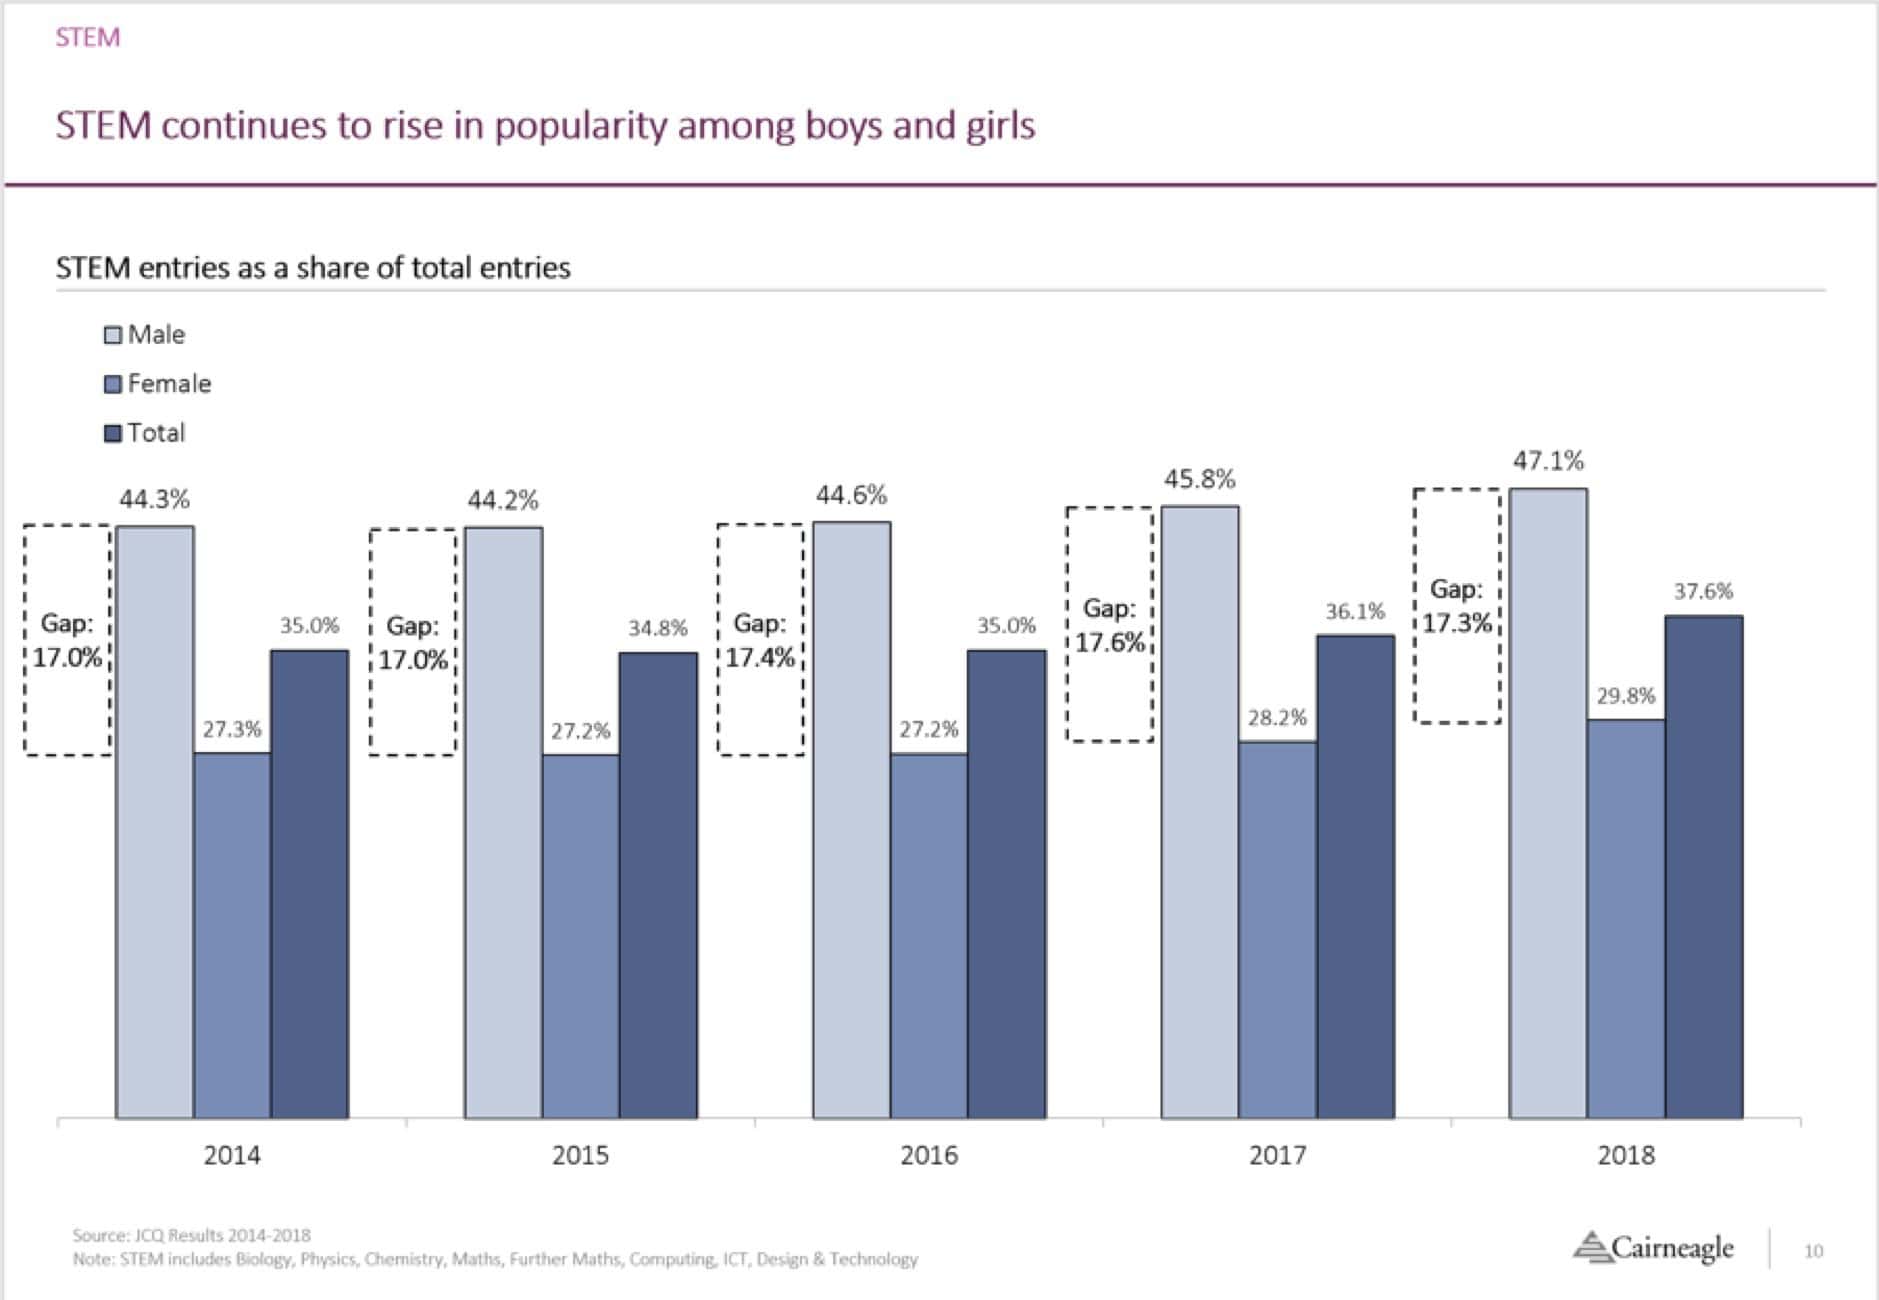
There’s no accepted definition of which subjects constitute STEM subjects, so we’ve used Biology, Physics, Chemistry, Mathematics, Further Mathematics, Computing, ICT, and Design & Technology. Using the proportion of total A level entries, the chart below shows that STEM is growing in popularity for both boys and girls, although boys are still significantly more likely than girls to enter for STEM subject.
The JCQ press release says the following on STEM:
Male students are more likely to study a STEM subject, with them making up 57.0% of all STEM entries. The balance, however, is starting to shift. More female students take Biology and Chemistry than male, with more male students taking Mathematics and Physics. But year on year comparisons show that females are closing the gap in these subjects, with entries rising 3.1% for Mathematics (compared to males rising 2.1%) and 6.9% in Physics (males rising 2.4%). There is still a long way to go to close the gap completely.
As the chart below shows, this is a slightly misleading picture. Although the numbers of pupils taking particular subjects is relevant, in terms of how preferences are changing over time, it can be seen that of those boys and girls who take A levels in the first place, boys are still more likely to take STEM subjects, and the gap between the sexes is fairly constant.
MFL (Modern Foreign Languages)
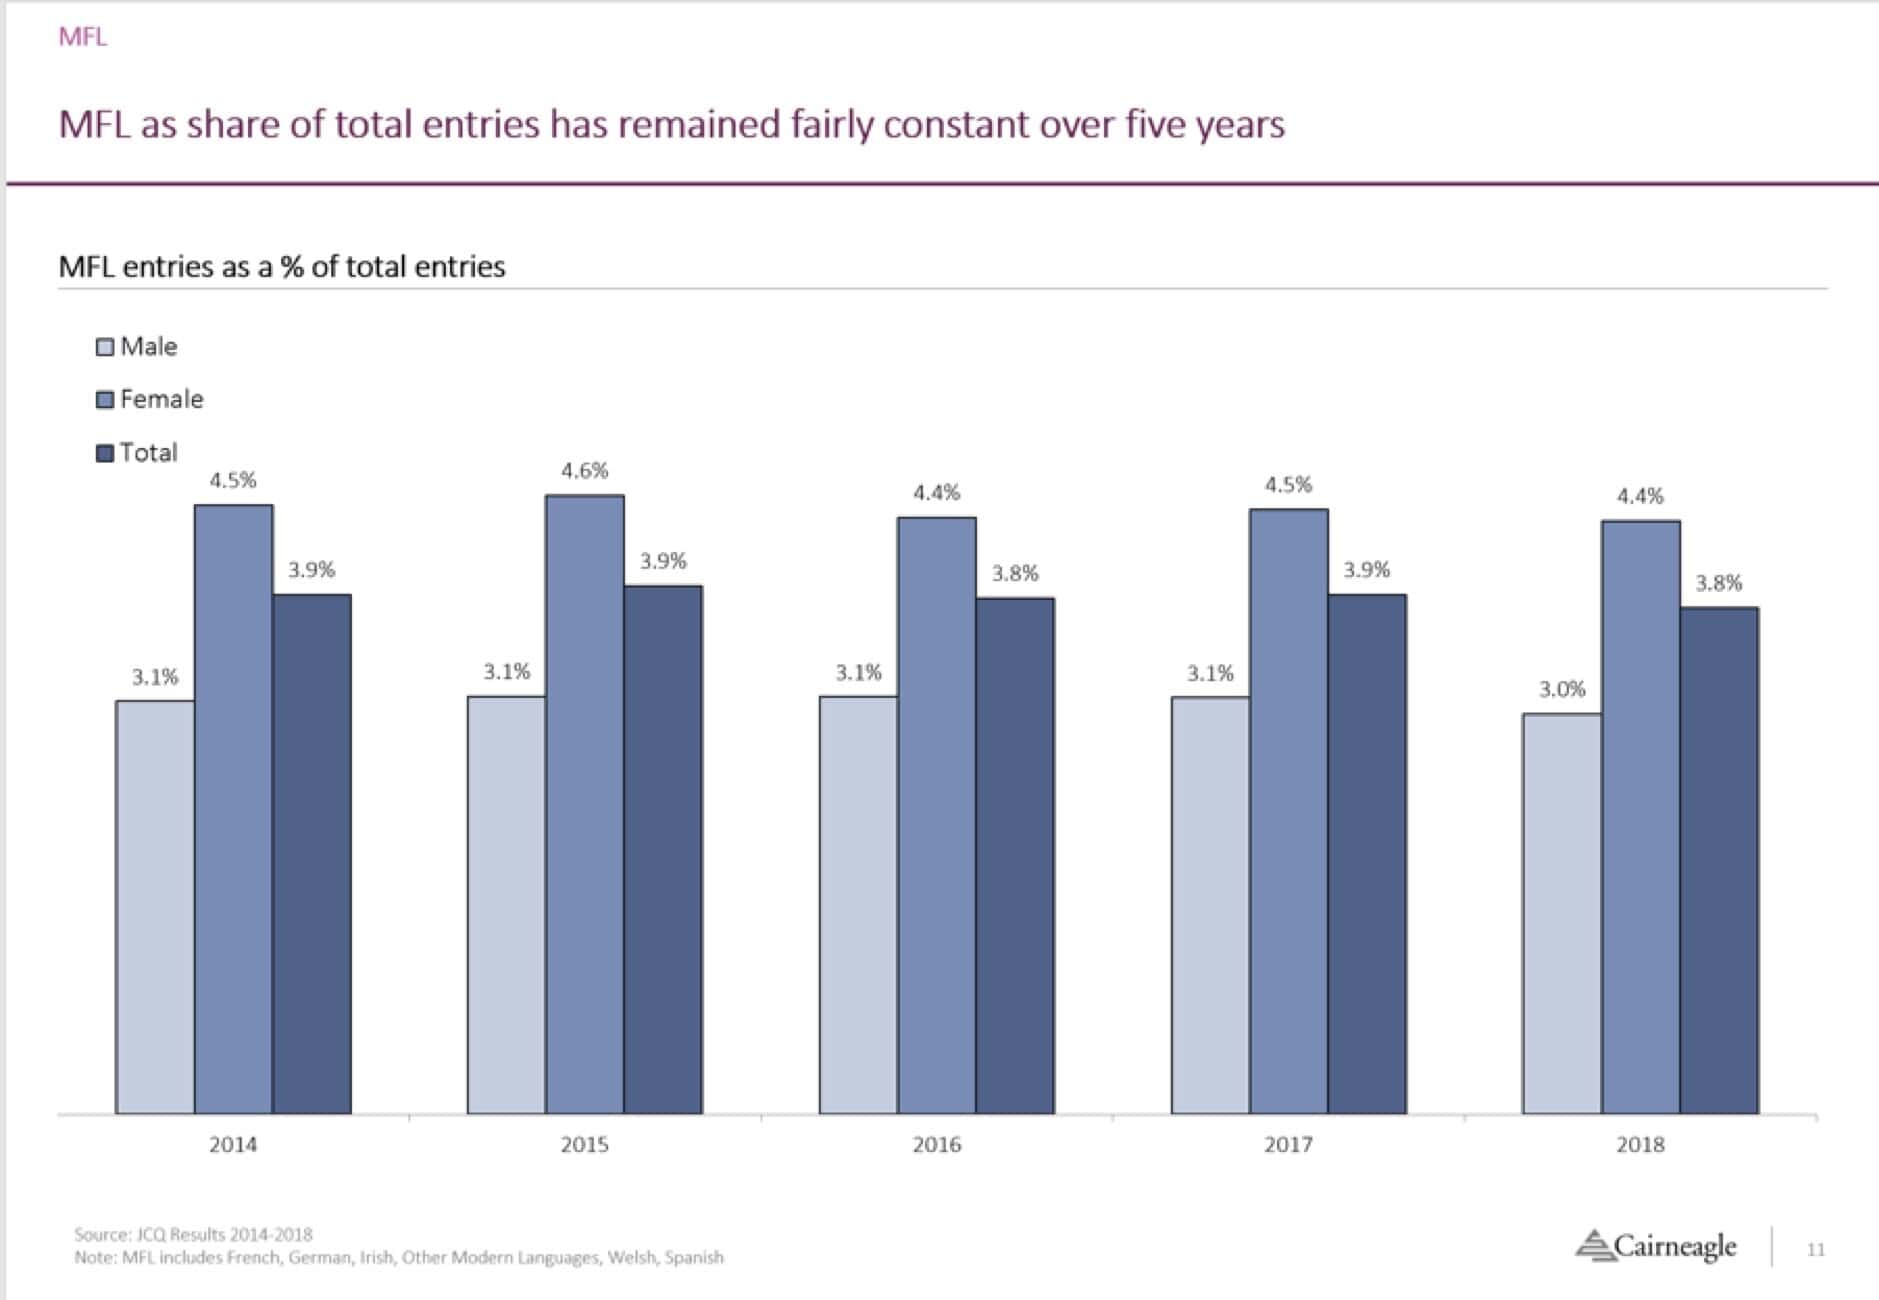
There has been much hand-wringing in the press about the demise of MFL at A level. However, when we aggregate MFL subjects (French, German, Irish, Other Modern Languages, Welsh, Spanish), and look at their share of total entries, which at least partially deals with population changes, a different picture emerges.
In fact, MFL’s popularity has remained remarkably steady and the much-publicised declines in French and German are being compensated by rises in popularity of other languages such as Mandarin. Entries for Chinese Languages at 3,334 (+3.1%) are now higher than for German (3,058) and perhaps warrant a separate data set in next year’s JCQ tables.
EPQ (the Extended Project Qualification)
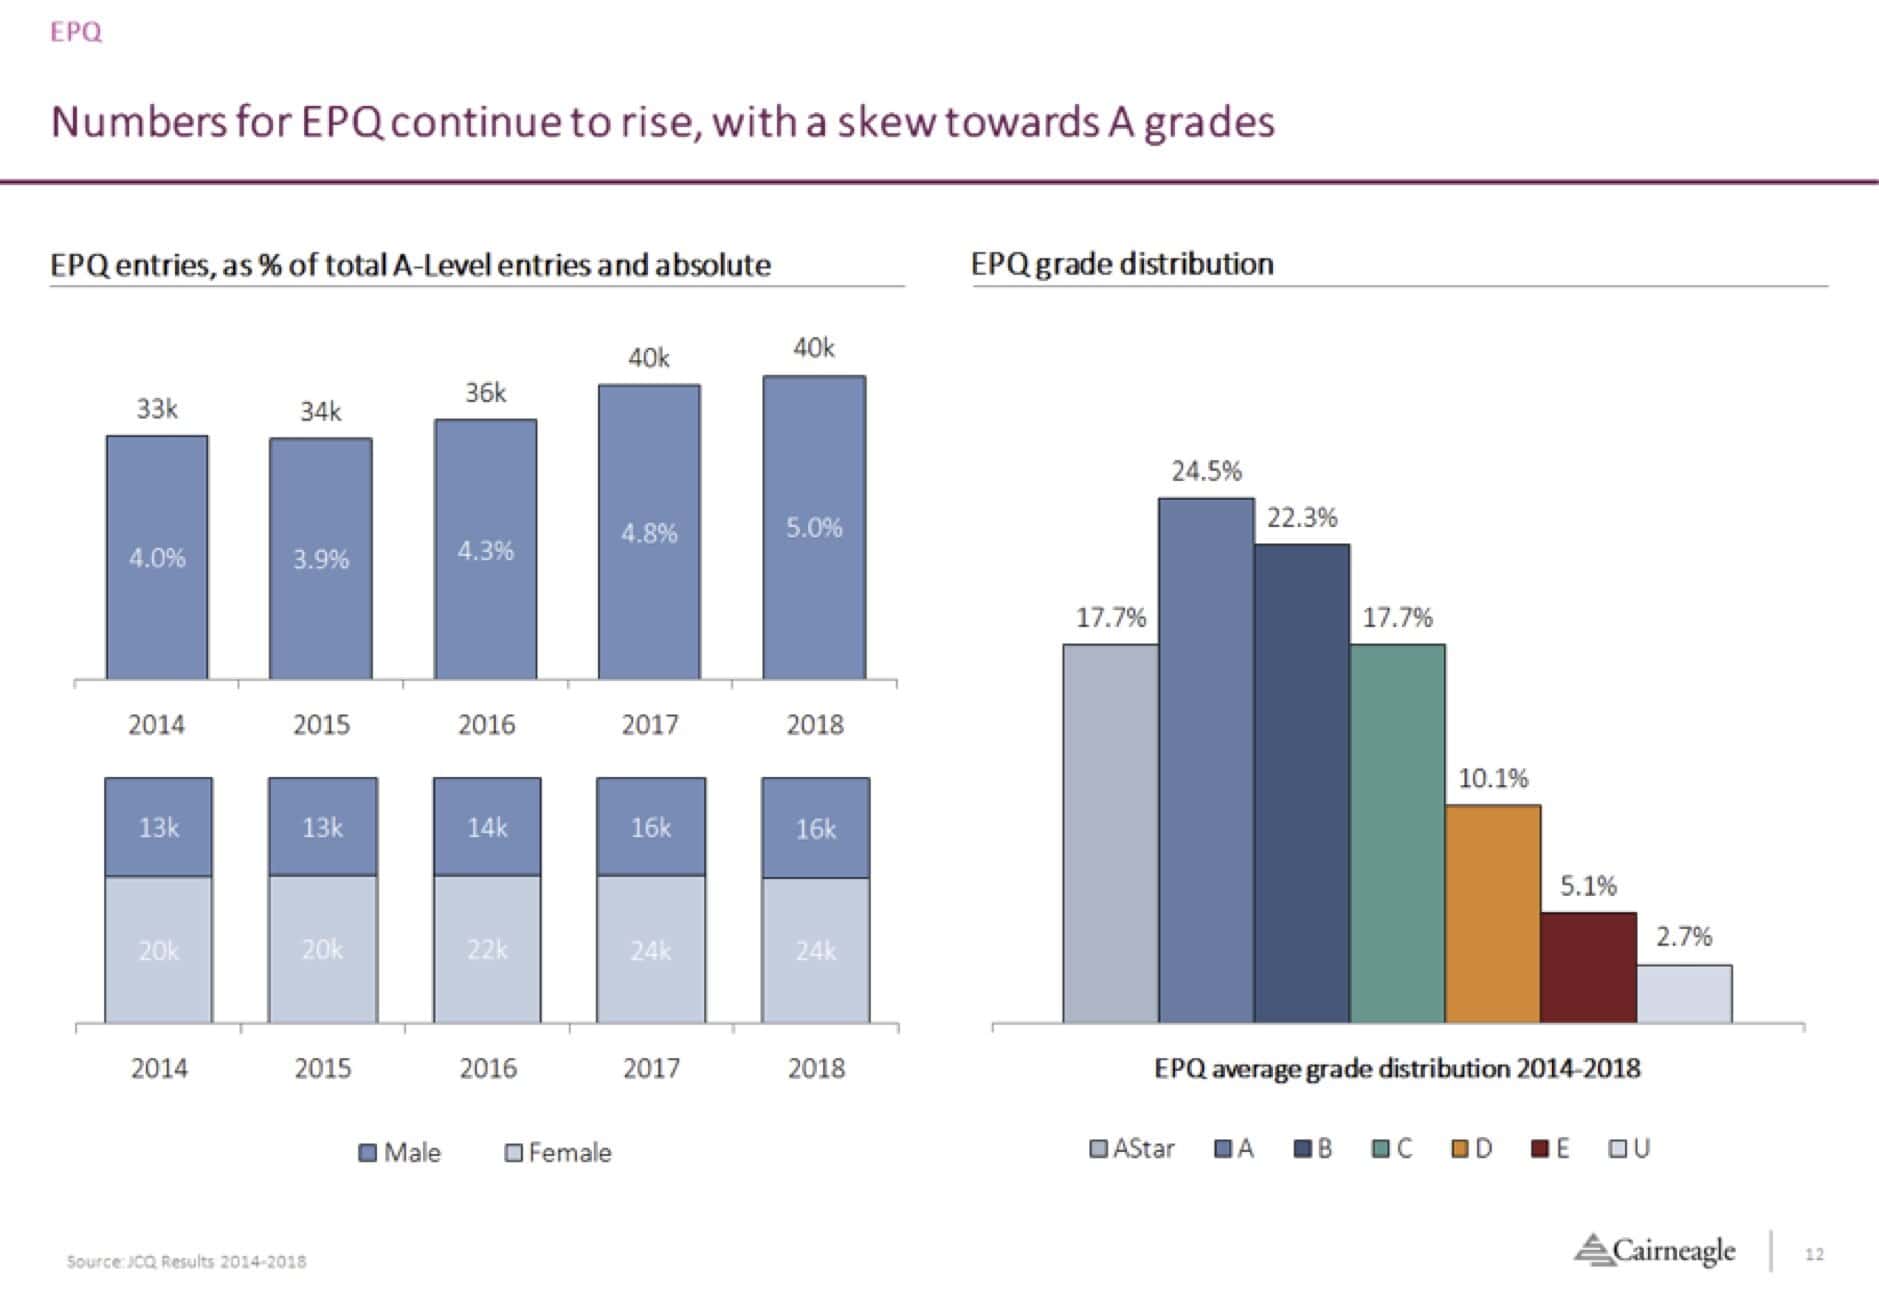
The EPQ is reported separately from A levels as it is more akin in size to the AS. However, following the move to linear A levels and the consequent focus on just three subjects for both sixth form years, the EPQ takes on even more importance as an increasing number of schools use it to broaden the Key Stage 5 curriculum.
As the chart below shows, both the number of EPQ entries and its share against total A level entries show its rise on the KS5 curriculum. However, the EPQ is another outlier in terms of the skew towards females (60:40, females to males) and in grade distribution. 42% of grades are awarded at A* / A.
Note: All data are extracted from the JCQ A levels results tables from the relevant years: https://www.jcq.org.uk/examination-results/a-levels.

Comments
Add comment