
WEEKEND READING: Part One: Experience of loneliness of incoming students
This blog was kindly authored by Dr Michelle Morgan, Dean of Students, University of East London and Dr David Gilani, Head of Access and Participation, Middlesex University
We know from numerous reports, including the UK Covid-19 Inquiry, Research on the measurement of loneliness and Cognitive testing of loneliness by the Office for National Statistics, that loneliness is prevalent in the UK. The Office for National Statistics (ONS) research showed that 33% of Britons aged 16 to 29 reported feeling lonely “often, always or some of the time”.
What is the prevalence of loneliness for new undergraduate and postgraduate taught (includes PG Certs/Diplomas, Masters and other PGT ) entrants starting university, and what can we do about it?
This is one of the many areas explored in the Pre-arrival Academic Questionnaire Pilot in England, funded by the Office for Students and led by Advance HE, Jisc and the University of East London. Phase one of the two-year project undertaken across fifteen institutions comprised of 5,548 undergraduate and 2,285 postgraduate taught completions.
Four questions were included. The first three questions were from the UCLA three-item loneliness scale, which is currently used in the English Longitudinal Study of Ageing , and the last is a direct question about how often the respondent feels lonely, currently used in the Community Life Survey. The questions were:
- How often do you feel that you lack companionship?
- How often do you feel left out?
- How often do you feel isolated from others?
- How often do you feel lonely?
And the response categories: Hardly ever or never / Some of the time / Often
The four questions have been analysed by key student characteristics across undergraduate and postgraduate taught levels of study. It is important to recognise and understand how our students feel so we can support them effectively within their university life.
What did the pilot find?
Domiciled status
When examined by domicile status and level of study, Non-UK undergraduate (UG) and postgraduate taught (PGT) students selected ‘some of the time’ more frequently for all four questions compared to UK UG and PGT (see Table 1). Lacked companionship was the loneliness marker that was most frequently selected by all groups.
When looking at the questions respondents selected ‘Often’ for, UK UG and PGT reported higher levels of loneliness than Non-UK UG and PGT, citing Felt lonely most frequently.
Table 1 Domiciled status by level of study ‘Some of the time’ and ‘Often’ responses
| UG Some of the time | UG Often | PGT Some of the time | PGT Often | |||||
| UK | Non-UK | UK | Non-UK | UK | Non-UK | UK | Non-UK | |
| Lacked companionship | 38.6% | 45.6% | 10.4% | 6.0% | 34.3% | 41.4% | 9.0% | 5.5% |
| Felt left out | 34.0% | 44.5% | 11.6% | 7.9% | 30.9% | 37.4% | 7.3% | 6.1% |
| Felt isolated | 33.4% | 39.1% | 12.3% | 8.7% | 29.7% | 33.9% | 9.7% | 7.2% |
| Felt lonely | 36.3% | 44.8% | 14.2% | 11.3% | 32.9% | 39.1% | 10.8% | 7.5% |
Sex
When sex is examined by the ‘Some of the time’ response, Lacked companionship was cited the most by both UG and PGT Females and Males (see Table 2). For ‘Often’ responses, Felt lonely was cited the most by both Females and Male undergraduates. However, at the postgraduate taught level, Felt isolated was cited most by Females, while for Males it was Felt lonely.
Table 2 Sex by level of study ‘Some of the time’ and ‘Often’ responses
| UG Some of the time | UG Often | PGT Some of the time | PGT Often | |||||
| Female | Male | Female | Male | Female | Male | Female | Male | |
| Lacked companionship | 39.8% | 35.7% | 11.1% | 8.3% | 36.2% | 41.2% | 8.4% | 5.4% |
| Felt left out | 35.5% | 30.7% | 12.9% | 7.5% | 33.6% | 36.8% | 8.5% | 4.7% |
| Felt isolated | 34.6% | 29.8% | 8.3% | 3.3% | 31.6% | 33.5% | 10.6% | 5.8% |
| Felt lonely | 39.1% | 31.0% | 14.9% | 11.8% | 35.7% | 37.9% | 5.5% | 6.4% |
COVID-19 study experience
The experience of the COVID-19 pandemic is still being felt by incoming undergraduate students, as the Pre-arrival questionnaire (PAQ) national pilot wave 1 initial results highlight. Responses for ‘Some of the time’ and ‘Often’ were higher for those in study during the pandemic than those who were not (see Table 3). Again Lacked companionship was most cited for the ‘Some of the time’ response and for ‘Often’ it was Felt lonely.
Table 3 Undergraduate and study status during the COVID-19 pandemic and ‘Some of the time’ and ‘Often’ responses
| Some of the time | Often | |||
| Yes in study | Not in study | Yes in study | Not in study | |
| Lacked companionship | 40.0% | 35.7% | 10.7% | 9.0% |
| Felt left out | 34.7% | 32.3% | 12.4% | 8.5% |
| Felt isolated | 34.0% | 31.3% | 13.1% | 9.1% |
| Felt lonely | 37.8% | 33.1% | 15.1% | 11.0% |
Undergraduate attendance in previous study
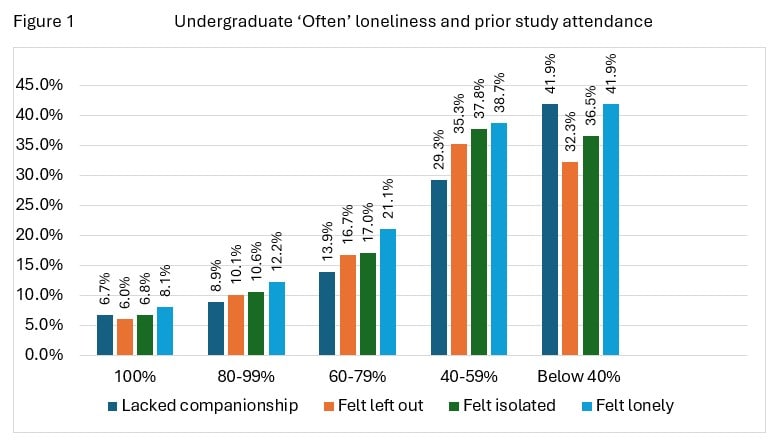
When prior study attendance of incoming undergraduates was examined, the frequence that ‘Often’ was cited across the four questions increased as attendance decreased (see Figure 1). As numbers from the Department of Education highlight, Pupil absence in schools in England continues to rise, with 150,000 children classed as severely absent, so this behavioural experience and impact on loneliness will continue.
Estranged and care experience
When the responses of those who are estranged from their family or who have care experience are examined, loneliness levels amongst those who have care experience are higher across all four questions than for those that do not (See Tables 3 and 4). Again, across both groups, Lacked companionship is the highest for ‘Some of the time’ and for ‘Often’ the most frequent response is Felt lonely.
These findings reflect those found in the Unite Foundation report Unseen and under pressure: the academic experience of estranged and care-experienced students (a report that took a deep dive into the HEPI and Advance HE Student Academic Experience Survey 2025).
Table 3 Estranged status and loneliness
| UG Some of the time | UG Often | PGT Some of the time | PGT Often | |||||
| Yes estranged | Not estranged | Yes estranged | Not estranged | Yes estranged | Not estranged | Yes estranged | Not estranged | |
| Lacked companionship | 43.1% | 38.2% | 15.3% | 9.9% | 45.1% | 37.2% | 17.6% | 6.2% |
| Felt left out | 35.6% | 33.7% | 13.0% | 11.0% | 40.7% | 33.7% | 15.4% | 6.2% |
| Felt isolated | 36.1% | 32.8% | 19.0% | 11.7% | 41.1% | 31.2% | 17.8% | 7.6% |
| Felt lonely | 36.1% | 36.3% | 22.2% | 13.4% | 31.9% | 36.6% | 22.0% | 7.8% |
Table 4 Care experienced and loneliness
| UG Some of the time | UG Often | PGT Some of the time | PGT Often | |||||
| Yes care exp | Not care exp | Yes care exp | Not care exp | Yes care exp | Not care exp | Yes care exp | Not care exp | |
| Lacked companionship | 50.7% | 38.2% | 11.0% | 9.8% | 45.4% | 36.5% | 5.6% | 7.0% |
| Felt left out | 44.9% | 34.3% | 14.4% | 10.9% | 46.1% | 32.6% | 5.7% | 7.0% |
| Felt isolated | 44.2% | 33.0% | 14.0% | 11.7 | 42.0% | 30.4% | 9.2% | 8.0% |
| Felt lonely | 42.4% | 36.6% | 17.3% | 13.6% | 45.2% | 35.3% | 8.1% | 8.9% |
Age
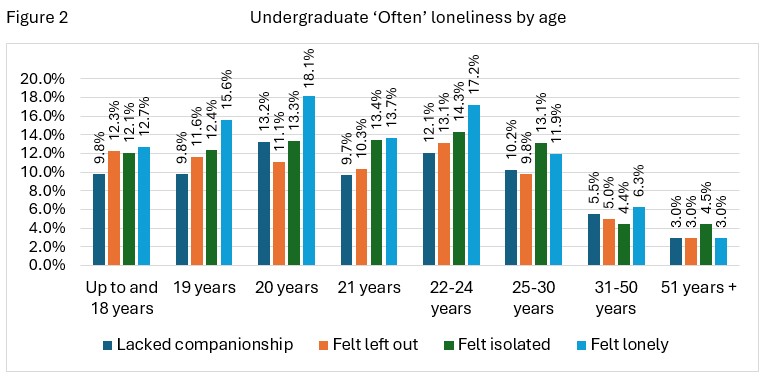
For both undergraduate and postgraduate taught responses, levels of loneliness across all questions are higher amongst 18 to 24 year olds than other age groups. This reflects the research of Professor Andrea Wigfield, Director of the Centre for Loneliness Studies at Sheffield Hallam University, which shows loneliness is higher amongst adults between 18 and 24.
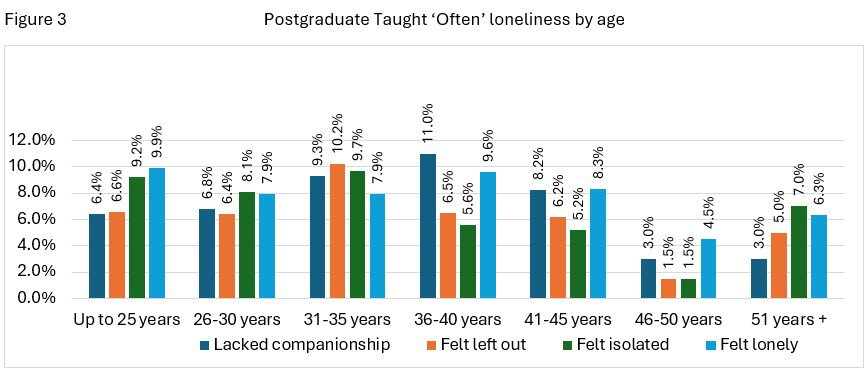
However, when we looking specifically at the loneliness levels of postgraduate taught students, ‘Often’ Feeling lonely was higher across the age groups up to 25 and 36-40 year olds (see Figure 3).
Ethnicity
When Ethnicity responses are examined, there were no notable differences amongst PGT respondents, but there were at UG level. Mixed and White Ethnic groups reported the highest levels of feeling loneliness ‘Often’. Within each group, Felt lonely was the highest across four of the groups.
Table 5 Type of Ethnicity ‘Often’ Loneliness by undergraduate level
| Asian | Black | Mixed | White | Other | |
| Lacked companionship | 7.8% | 6.7% | 13.0% | 12.3% | 7.1% |
| Felt left out | 8.8% | 9.5% | 10.7% | 11.5% | 9.6% |
| Felt isolated | 9.3% | 9.8% | 11.3% | 13.9% | 12.2% |
| Felt lonely | 12.0% | 10.7% | 16.3% | 15.3% | 10.9% |
Disability
When examined by disability across health, mental and physical disabilities, it will not be a surprise to see that levels of feeling lonely ‘Often’ are higher for those with disabilities than for those who do not have one. Again, this reflects the findings found in the Office for National Statistics Disability, well-being and loneliness, UK – Office for National Statistics and the UK Government Disability, loneliness and relationships reports.
When different disabilities were explored, there were notable differences by both type of disability and level of study (see Table 6).
Undergraduate loneliness responses were higher than postgraduate taught across all questions but one, with physical disability having the highest ‘Often’ responses. For PGT, Lack of companionship was the highest amongst those with a mental disability, Felt left out and Felt lonely was highest amongst those with a health disability, and for Felt isolated it was those with physical disabilities who reported this most frequently.
Table 6 Type of disability ‘Often’ Loneliness’ by level of study
| Health | Mental | Physical | ||||
| UG | PGT | UG | PGT | UG | PGT | |
| Lacked companionship | 23.4% | 15.6% | 20.7% | 17.5% | 28.3% | 17.2% |
| Felt left out | 22.8% | 20.0% | 23.3% | 18.7% | 31.1% | 18.8% |
| Felt isolated | 22.8% | 20.5% | 25.0% | 22.7% | 31.5% | 26.6% |
| Felt lonely | 24.8% | 30.5% | 30.5% | 25.2% | 34.2% | 25.0% |
Summary
This blog highlights the complexity of ‘loneliness’ across a range of student characteristics. As Dr Gareth Hughes, Clinical Lead for Student Space, says when talking about overcoming loneliness at university:
loneliness is a normal human response to the absence of something we need. It’s like feeling hungry as a response to needing food. Loneliness is simply a warning sign that we need to act to improve our social connections.
Part two, will look at the assumptions about loneliness and belonging that the sector is at risk of making, and will suggest practical steps institutions can take to mitigate these risks to help navigate the ‘loneliness’ journey at university by improving social connections throughout the study journey.




Comments
Add comment