
WEEKEND READING: How the UCAS process magnifies inequality: part one
Join HEPI and Unite Students for a webinar on Wednesday 24 June 2026, from 11am to 12pm, marking the launch of the fifth annual Unite Students’ Applicant Index 2026. Drawing on one of the sector’s most comprehensive surveys of university applicants, the session will explore new insights into prospective students’ finances, wellbeing, resilience, learning, employment and preparedness for university, helping institutions understand what to expect from the next cohort arriving this autumn. Register now.
This blog was kindly authored by Arif Struthers, Founder of UniMetrica.
The evidence
The direction of travel for the 2026 UCAS admissions consultation is towards a reconceived and expanded Clearing. Historically having been perceived as a fire-sale where students disappointed by their A-Level results often end up equally disappointed by their choice of course, UCAS argue this characterisation is archaic. Indeed, the number of applicants who participate in this fire-sale willingly, hoping to land a course better than the offers they rejected, is now higher than those who arrive disappointed.
A reformed Clearing somewhat resembles an opt-in Post-Qualification Admissions (PQA) system, as it occurs after students receive their A-Level results. Thus, it may see many of the upsides of PQA, avoiding the oft-cited criticisms of predicted grades entirely, without the administrative revolution needed for full PQA reform. The former UCAS CEO, Mary Curnock Cook CBE, described an enhanced Clearing as:
giving choice and agency to students and could also presage a more gradual market-driven change in favour of a post-results system, avoiding the highly risky big-bang change approach.
While the 2026 consultation is clear about the importance of Clearing reform, the mechanics and structure of the ‘Clearing process for the future’ remain yet to be either designed or publicly disclosed.
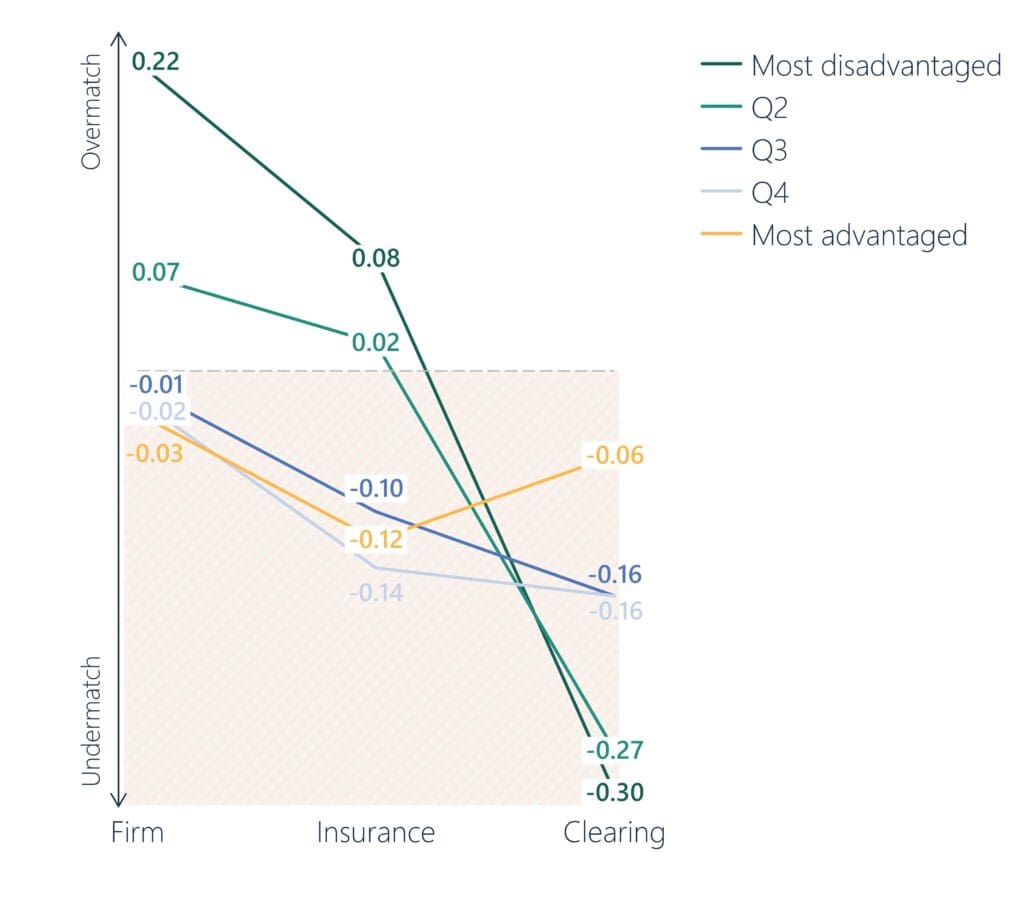
In this context, it is necessary to shine some light on an underappreciated chart that is buried in a research report from the 2026 UCAS consultation. It is in need of further analysis. It shows how academic match varies by socioeconomic status, as students progress from Firm to Insurance to Clearing.
Academic match measures the difference between a student’s actual A-Levels and the median A-Levels of the cohort at the student’s chosen course. Hence, a score of 0.22 means that the student is overmatched by ~1/5th of a full A-Level grade, and is attending a course that they find too difficult compared to their peers. While overmatching presents its social challenges, such as greater drop-out rates, undermatching is a far graver social issue. A negative score of -0.30 means that the student, on average, received 0.3 A-Level grades higher than their peers in their cohort. It means that they are at a course that is too easy, having not fully realised their academic potential.
Academic match is often used as a proxy for fit by UCAS and the academic literature, mainly because the data are readily available and quantifiable. It is by no means a perfect measure. The best-matched course for any given student is not necessarily the most academically selective one their grades would allow, but the one that also reflects other things they may care about, such as cultural fit, teaching scores and proximity to home. Were a purer measure of fit available, the outcome inequalities described here may even be greater than those captured by academic match alone.
Crucially, within high-attaining students, undermatching occurs more frequently and with greater severity among students from lower socio-economic backgrounds. Campbell et al. determined this gap to be worth, in median earnings difference after 5 years, £13,200 per year – or the difference between studying economics at LSE and Exeter. As such, undermatching has deservedly received sustained attention from academics, aiming to identify its causes and possible solutions. Explanations tend to focus either on students’ applications (demand) or universities’ admissions policies (supply). These are neatly summarised by Blanden et al.’s 2025 contribution, where they discussed as possible factors: differences in pupils’ risk aversion, parental intervention and encouragement, school culture, and structural biases within university admissions. Largely absent from these explanations, and within the literature generally, is the market design of the UCAS process itself.
What then, does the graph actually tell us? Students from the most disadvantaged backgrounds overmatch their Firm choice by 0.22 of an A-Level grade, overmatch their Insurance by a smaller margin, and then, in Clearing, decline very starkly to undermatch by -0.30 of a grade. It is an accelerating slide through the phases that has no equivalent in the trajectory of their most advantaged peers, who track more or less flat across Firm and Insurance and, oddly enough, are the only quintile to improve at Clearing, drifting from -0.12 to -0.06.
Both demand and supply-side explanations struggle to explain the volatility and divergence between quintiles that emerges after offers are made. Thus, the argument is that the design of the UCAS process itself must multiply the inequalities that produce undermatching. Its design structurally rewards a specific bundle of resources at each stage, such as good admissions intelligence, geographic mobility, reliable predicted grades, and a measure of tolerance for risk. These are precisely the resources the literature consistently identifies as scarcest among disadvantaged students. Seen against this, the spread of average outcomes by quintile shown in the following graph is no surprise; it is, however, sobering.
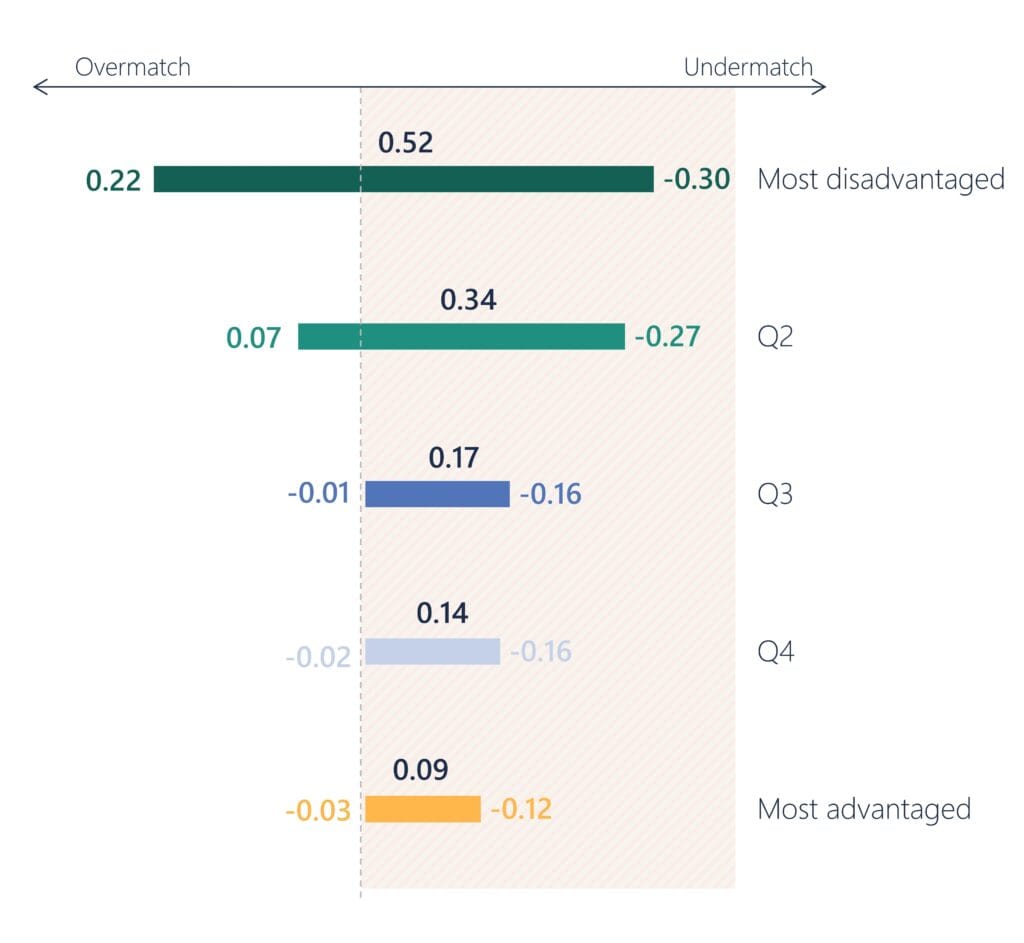
The most disadvantaged quintile (0.52) experiences nearly six times the within-applicant volatility of the most advantaged (0.09). It is the signature of a market design that systematically converts unequal inputs into more unequal outputs.
So how does it happen?
The underlying mechanics are best illustrated by introducing two applicants, Tom and William. Both are predicted AAA, both have applied to the five courses with the same offer spread, and both have received offers from all five; their position on paper is identical. The difference lies elsewhere. Tom comes from a privileged background and attends a well-resourced independent school, where he is carefully guided through his choices and actively encouraged to accept a place at the most competitive university his grades will reach. William attends a state school that offers little personal academic guidance and still less in the way of admissions counselling, where the single stretched member of staff responsible for the cohort, in the interests of fairness, can spare only 7 minutes for each student. Though stylised, let Tom and William represent the archetypal average advantaged and disadvantaged high-attainment student, respectively. Let’s see what happens to them under different scenarios.
The walkthrough and proposals
This example now walks through what happens to Tom and William at Firm. In part two of this blog we will consider Insurance and Clearing.
Firm
At the Firm stage, an applicant faces two unknowns over which they have no control:
- Prediction error: the difference between the student’s Predicted Grades and their actual grades. Murphy and Wyness show that for high-attaining students like William and Tom, state school students are roughly twice as likely to be underpredicted by two or more grades (23 per cent vs. 11 per cent).
- Course flex willingness: the gap between the A-Level offer grades and the level the course is, in fact, prepared to admit students on results day. The Sutton Trust reported that this concept is “well understood only by the best informed schools and colleges.”
Given these variables, the matrix below sets out the possible scenarios. These matrices are slightly simplified for readability.
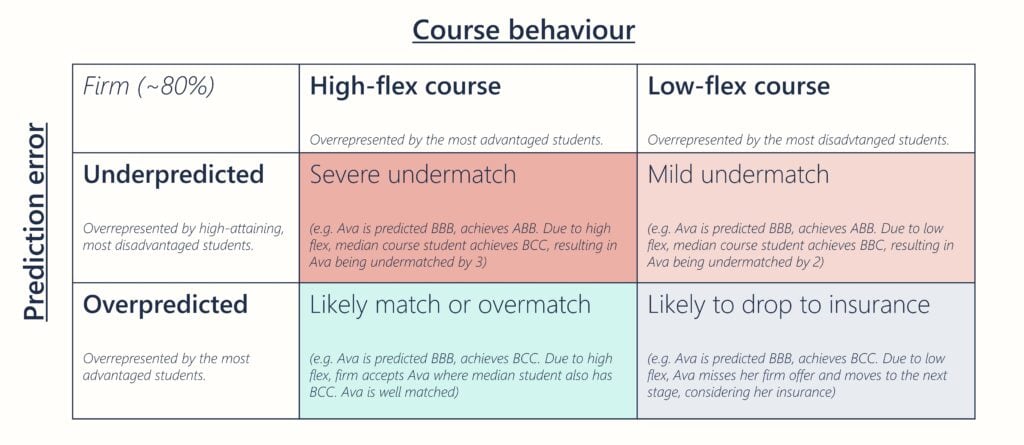
Tom, well briefed on the fact that a published offer is indicative rather than binding, takes the most ambitious of the five, A*AA, as his firm. William, however, takes the offer that matches his AAA prediction, reasonably assuming that the offer letters mean what they say. Tom achieves AAB, being a grade overpredicted; William achieves A*AA, being a grade underpredicted. Tom’s course, which flexes generously, admits him anyway, against a cohort whose median entrant sits 1 below the advertised at AAA. With his AAB actuals, Tom finds himself overmatched by 1 grade.
William’s course also flexes, but William, having met his offer cleanly, has no need of it; the course admits him against a cohort that has been admitted, on average, one grade below the published threshold. With grades of A*AA against a median of AAB, William is undermatched by 2 grades. Two boys who began the cycle with identical predictions and identical offer portfolios ended it 3 grades apart.
The next part of this blog, out tomorrow, completes the story, discussing the market design challenges at the Insurance and Clearing stages.



Comments
Jonathan Alltimes says:
The two unknowns of prediction error and course flex willingness are not a product of UCAS, but the school and the provider and so are outside of their control. I suppose with computerization it is increasingly likely that applications could processed rapidly after results are known. Course flex willingness is underdetermined and is likely to change from yeat to year.
What is academic match? The argument proposes the possibility of a better match between student and course as determined by A-level grades with better consequences. Is there a better model repesenting the reality of the match between student and course, than the statistic proposed here? The model proposes that a better academic match between student and course is possible by substituting imaginery examples for historical examples of the process. The UCAS system is not a market as the student does not know what they are buying, even if the price of exchange is partially known by the admission criteria, such as A-levels. The argument presumes that academic match can be improved. The notion of academic match is another example of thinking up statistics because the data is available without explaining the theory. The theory is not independent of the data. What does academic match mean in terms of qualititative historical examples? There is no way of knowing if one course is better for a student than another course in terms of a student being more or less satisfied or disappointed before or after the application process. The use of pay as a measure of academic match is a post-hoc justification for improving academic match in terms of a statistical model, but it does not explain how the process of academic match can improve pay other than better A-level grades as an input into the process and that points to the need for better teaching and application coaching in state schools. The whole argument thinks there is an attainable ideal by removing error, when in historical fact we do not know if better choices could have been made against this vague standard.
Reply
Add comment