WEEKEND READING: How the UCAS process magnifies inequality: part two
Join HEPI and Unite Students for a webinar on Wednesday 24 June 2026, from 11am to 12pm, marking the launch of the fifth annual Unite Students’ Applicant Index 2026. Drawing on one of the sector’s most comprehensive surveys of university applicants, the session will explore new insights into prospective students’ finances, wellbeing, resilience, learning, employment and preparedness for university, helping institutions understand what to expect from the next cohort arriving this autumn. Register now.
This blog was kindly authored by Arif Struthers, Founder of UniMetrica.
At the end of part one, we introduced Tom and William and discussed how inequalities are magnified at the Firm stage. This piece now walks through what happens to them at Insurance and Clearing.
Insurance
The Insurance pathway is arguably the cleanest example of UCAS’s market design problem. It is, however, also the least used and where the empirical data is scarcest. Only ~7 per cent of students were placed through Insurance. Interestingly, 25 per cent of students placed at their insurance choice declined their place and entered Clearing. A possible explanation for the greater willingness to reject insurance offers is the difficulty of making the correct insurance choice from the five. The applicant can only make one decision to accurately optimise for three unknowns, each out of their control. The decision is the size of their insurance gap, meaning the difference between the offer grades at Firm and Insurance. With it, they must:
- balance their belief about their prediction error;
- the willingness of their firm offer to flex; and
- the willingness of their insurance offer to flex.
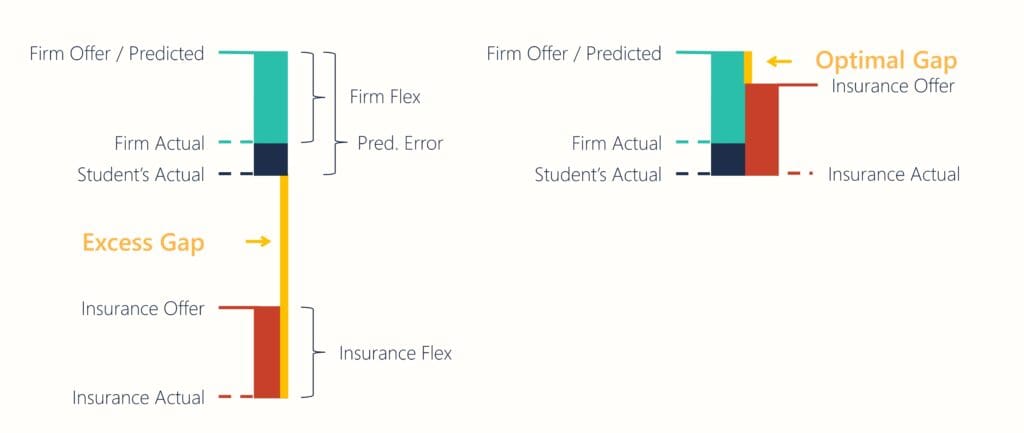
The exhibit makes clear that, in most cases, the optimal gap is often much smaller than it appears intuitively, and that in any case, it is very difficult to size. It follows that better-informed students with better resources would be, all things being equal, more likely to size the gap optimally. However, the data states that the most disadvantaged quintile only selects a gap 0.06 larger than the most advantaged, where the mean insurance gap is approximately one grade point. Strangely, 22 per cent of applicants chose no insurance gap at all, and, even more strangely, 14 per cent of applicants chose a negative gap, i.e. an insurance choice with higher entry requirements than the firm choice.
UCAS itself admits this could be due to differences in insurance flex, but states it cannot be sure. Perhaps that is the point worth dwelling on: a phase whose design is sufficiently opaque that even those who built it, with the full data in front of them, cannot quite tell what it is doing. The mechanics of Insurance warrant closer study than there is space for here, and a good deal of interesting material has been left out for brevity. That matters all the more because Insurance, in some form, is likely to remain. The Insurance stage produces the following matrix:
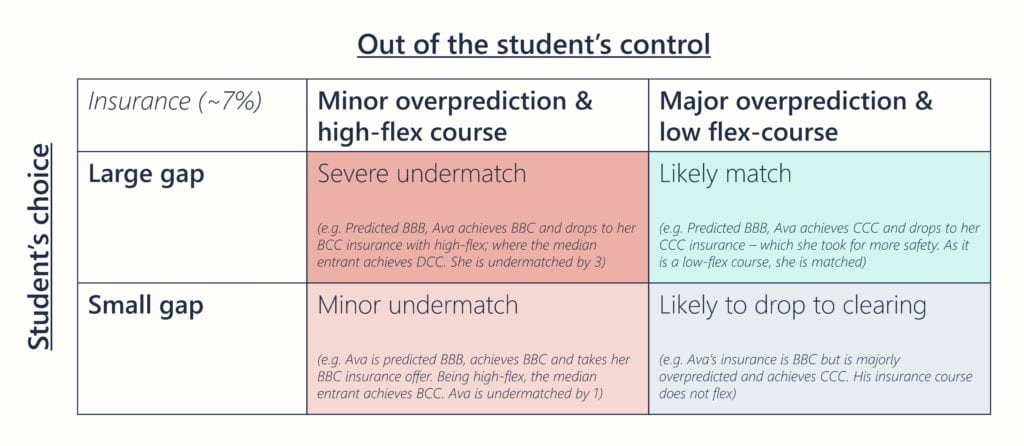
In this case, Tom achieves ABB and misses his firm choice. He, owing to the advice of his university counsellors, chose an insurance that matched his predicted grades, namely AAA. He did so with the understanding that this course has historically flexed its offer by two grades. This proved correct, and Tom is accepted onto a course where the median cohort, similarly flexed, also sits at ABB. Tom is well matched.
William, lacking the same counsel, falls back on the perfectly reasonable instinct that an insurance ought to sit a couple of grades below the firm, and chooses a gap of two. Like Tom, he was predicted AAA, and like Tom he achieves ABB. To his own eye, the gap has been sized correctly. What he has not been told, and what the published offer letter does not say, is that his course flexes by the same two grades that Tom’s does. His new peers sit, on average, at BBC. William is undermatched by two grades, on the same achievement, in the same cycle, and by the same mechanism that has just placed Tom at the median.
Clearing
Clearing is where undermatching inequality is magnified to the greatest extent. Although it accounts for ~13 per cent of applicants overall, its share has steadily been rising. The average disadvantaged student falls from 0.08 overmatched in Insurance to -0.30 undermatched in Clearing. In contrast, the average advantaged applicant rises from -0.12 to -0.06. Two variables do the work.
- Search quality refers to how well a student runs their Clearing process. Advantaged students tend to do considerably better. They understand the process, have spoken to more people who have been through it, and recognise the urgency.
- Course availability refers to the supply of well-matched courses for the student available in Clearing. Disadvantaged students apply to more competitive courses where clearing places are rare. In addition, 75 per cent of the most disadvantaged quintile in Clearing live at home while studying. Both these factors severely constrain the number of similarly matched courses available to them.
Tom achieves ABB, two full grades short of his prediction. A high tariff provider, which is his insurance choice, lets him know that it is willing to flex regardless. His private tutor has, however, briefed him on a more interesting possibility: if he is quick about it, a very high tariff provider has recently been admitting applicants of exactly his profile in Clearing, and he can trade up if he releases himself. While Tom hopes to land his firm, he is ready to call this very high tariff provider the moment results are released, if needed. Upon hearing the news, Tom briefly postpones his disappointment and immediately calls this other university, where he is offered a place on the same morning. Here, his peers average AAA, and Tom is overmatched by two grades.
William also achieves ABB, and misses both offers; his insurance, unwilling to flex because he chose Medicine, the most competitive subject in the UK, lets him go. He is shocked and stressed by missing both of his offers, and spends the morning processing and consoling with family, not knowing how frantic the Clearing process is for the most competitive courses. By the afternoon, when he begins to look, the Medicine places have gone. Only then does he stumble across an article that says that there are usually fewer than 10 Medicine Clearing places in the entire country, and that they often disappear within minutes. The stress of missing both offers is now compounded by the stark possibility that the career he has wanted for years may be out of reach.
What is more, William cannot afford to live away from home, which fixes him in the North East, where the strong universities within reach are few. His A-level choices, picked years ago with Medicine in mind, are too specialised for most of what remains. Clearing is sold as the system’s safety net, but for William it is a snare. The social constraints he came in with do not loosen at this stage but bind harder. In the end, he finds one of the few courses remaining willing to take him: Biomedical Science at a local university, where the median grade is BCC. William has undermatched by three grade points.
The temptation to read William as a contrived extreme is understandable but, on the data, misguided. Exhibit A in part one shows that the Clearing drop-off is extreme, precisely because course constraints, information asymmetry, and time pressure all bind at the same moment. It is socially regressive by design. Clearing is a fire-sale not only in the figurative sense but also in the literal one, as universities must clear their remaining places within a short window. Why, then, the proposal to expand the one phase of admissions designed in the image of a Black Friday sale?
Recommendations
Deferred acceptance algorithm for Clearing
Some have proposed a matching algorithm, like the one used to allocate London pupils to schools. Under which students rank their courses, universities rank their applicants, and it assigns each student to the best course they qualify for. In practice, the most academically selective course that one’s grades would allow is not necessarily the best fit, and any honest treatment of the question would need to quantify fit by way of the other factors that often matter more to students, such as proximity to home, teaching quality, the staff-to-student ratio and cultural match. Assuming this could be done, applying this algorithm to Clearing would neutralise the fire-sale dynamics described above in favour of an ordered, fair queue. It can be designed to be socially progressive, with universities filling access places first, as proposed by Doğan and Erdil in 2025. Clearing Plus got halfway there, but the matching is one-sided, as only universities submit their preferences to the algorithm without input from the students.
Minimise information asymmetries
Much of the issue stems from the fact that applicants are acting with imperfect information. Students with better information about their likely prediction error and firm flex willingness are much less likely to undermatch. The UCAS Historical Grades tool, launched in 2024, is an attempt to correct for this. Its direction is correct, but its execution is flawed. Students have been quick to flag inconsistencies across universities, small sample sizes, and UCAS’s own guidance, which instructs users not to draw predictive inferences from the data, is self-defeating.
Early two-way signals
While prediction error is very difficult to predict, insurance gaps, firm flex and insurance flex are easier. Even prediction error can be partly captured by covariates: socioeconomic information, GCSE attainment, subject concentration, and, most directly, the student’s own answer to the question of whether they suspect they have been over-predicted. Taken together, these inputs allow students at high risk of severe undermatching to be identified before Clearing opens, and the resulting signal can be sent to both sides of the market. For the student, the message can be advisory: “Something to consider: Clearing is likely to offer you a better match than your insurance.” The value of receiving it before results day, rather than at the moment of decision under time pressure, is that the student can prepare, research the alternative courses, and act with the kind of information disadvantaged applicants have so far been least likely to hold. For the university, the signal helps reduce marketing spend, of which Clearing often constitutes a significant portion.


Comments
Add comment