Education spending across the age range
This post is an extract of a speech by Nick Hillman, HEPI Director, to the Institute for Fiscal Studies at the launch of their paper on education spending across the age range.
This important new piece of work from the Institute for Fiscal Studies on education spending fills a hole by providing a robust and comparable time series.
I recently attended the Political Studies Association’s Annual AΩwards Dinner. The book prize went to Christopher Hood and Ruth Dixon for their assessment of the costs of central government reform, and afterwards they bemoaned the difficulties they had faced arising from the absence of consistent time series data. It was a powerful reminder of how rare really good time series data are, and how important they are for policymakers too. So I welcome the report wholeheartedly.
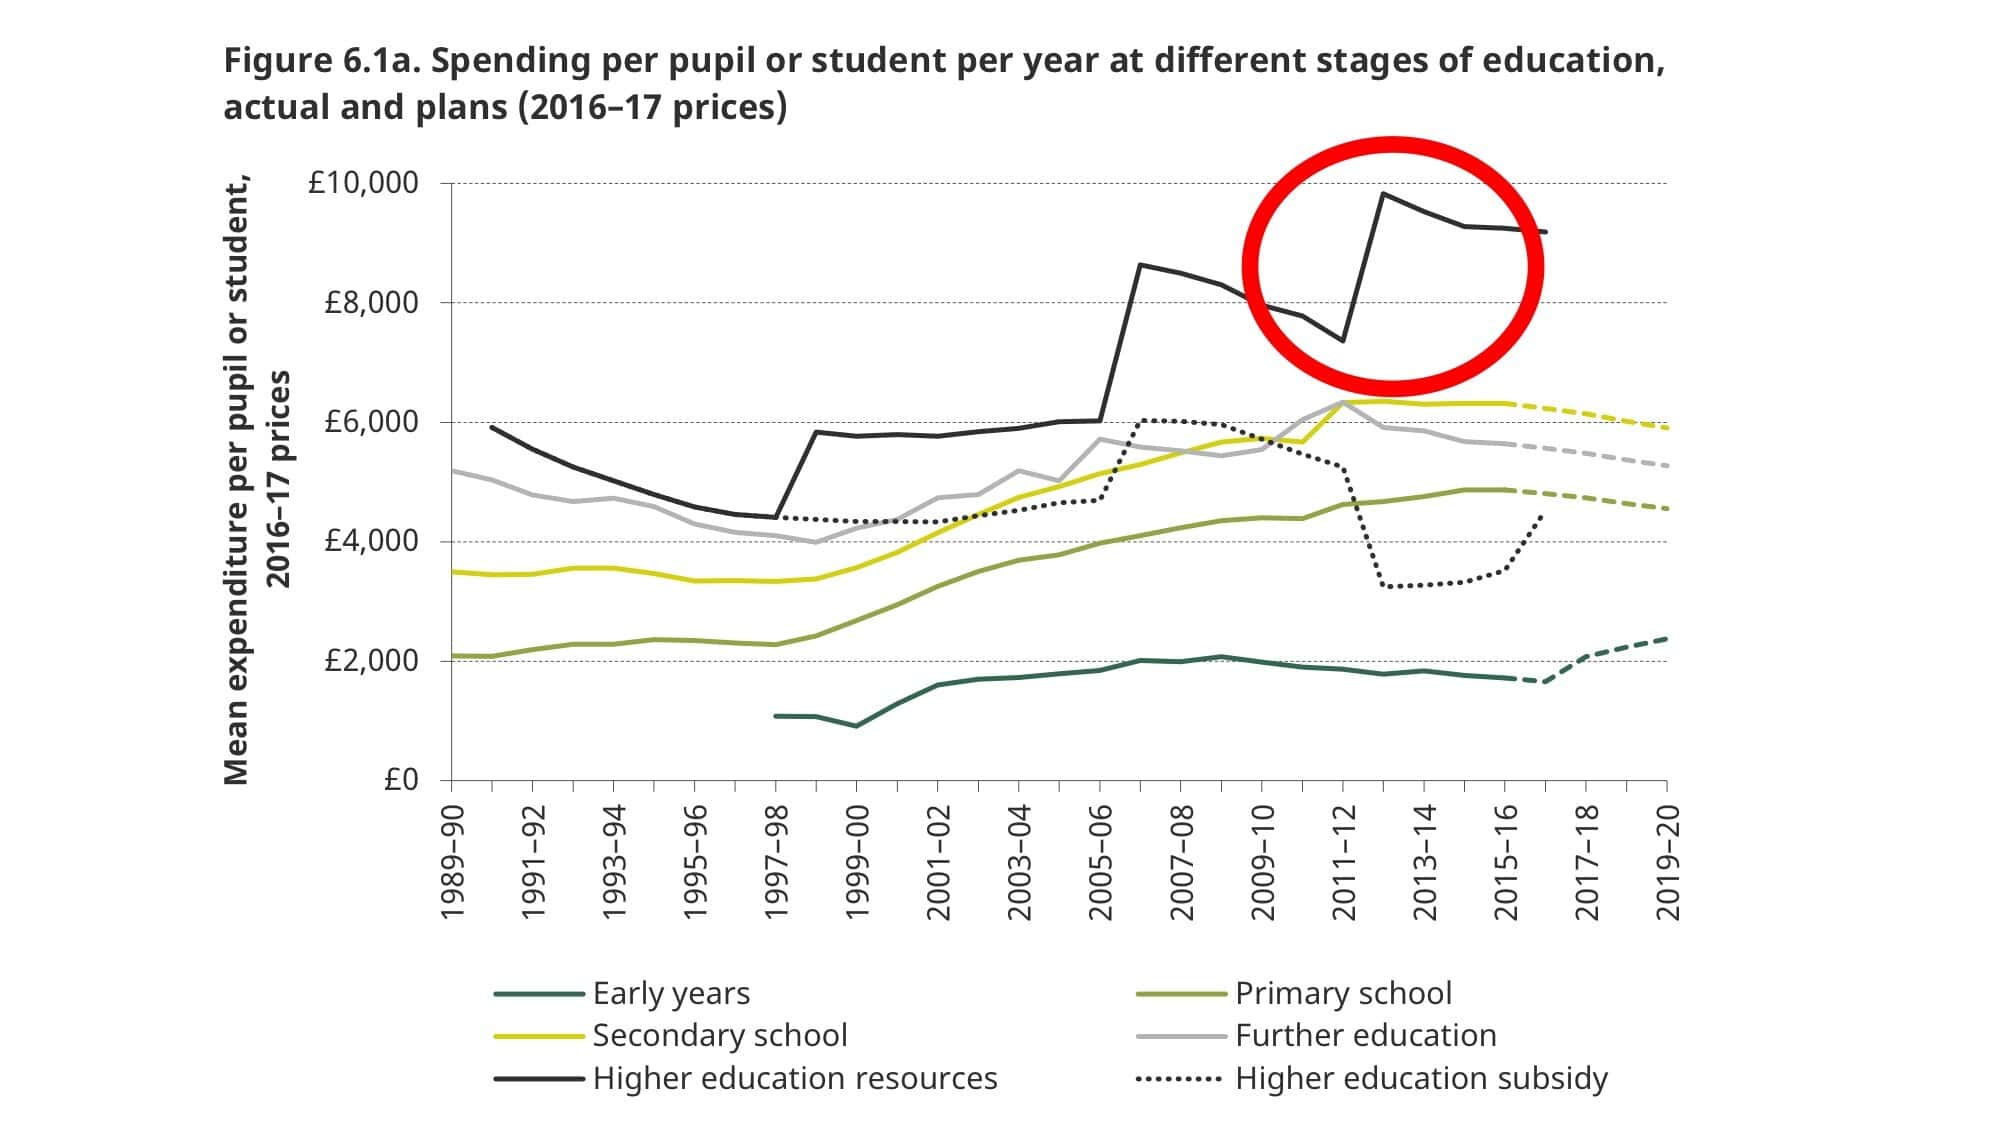
When moving from the IFS’s time series figures to the snapshot numbers for spending in 2015/16, the headlines are pretty stark. Spending increases up the age range until you get to those aged 16 to 18, when it drops back down somewhat. If I have understood the text correctly, then spending per beneficiary is:
- £1,700 in pre-school provision
- £4,900 in primary school
- £6,300 in secondary school
- £5,600 at 16-18
However, for my area of expertise – higher education – the lessons are less clear. The charts in the paper suggest there has been a staircase in terms of total resources for teaching undergraduates – although, admittedly, it is a slightly wonky staircase.
According to the paper:
- ‘This is in stark contrast to’ the other areas of education spending under review.
- Universities have had less funding for teaching in 18 of the last 26 years.
- There have been ‘significant inefficiencies in how’ universities makes their funding decisions.
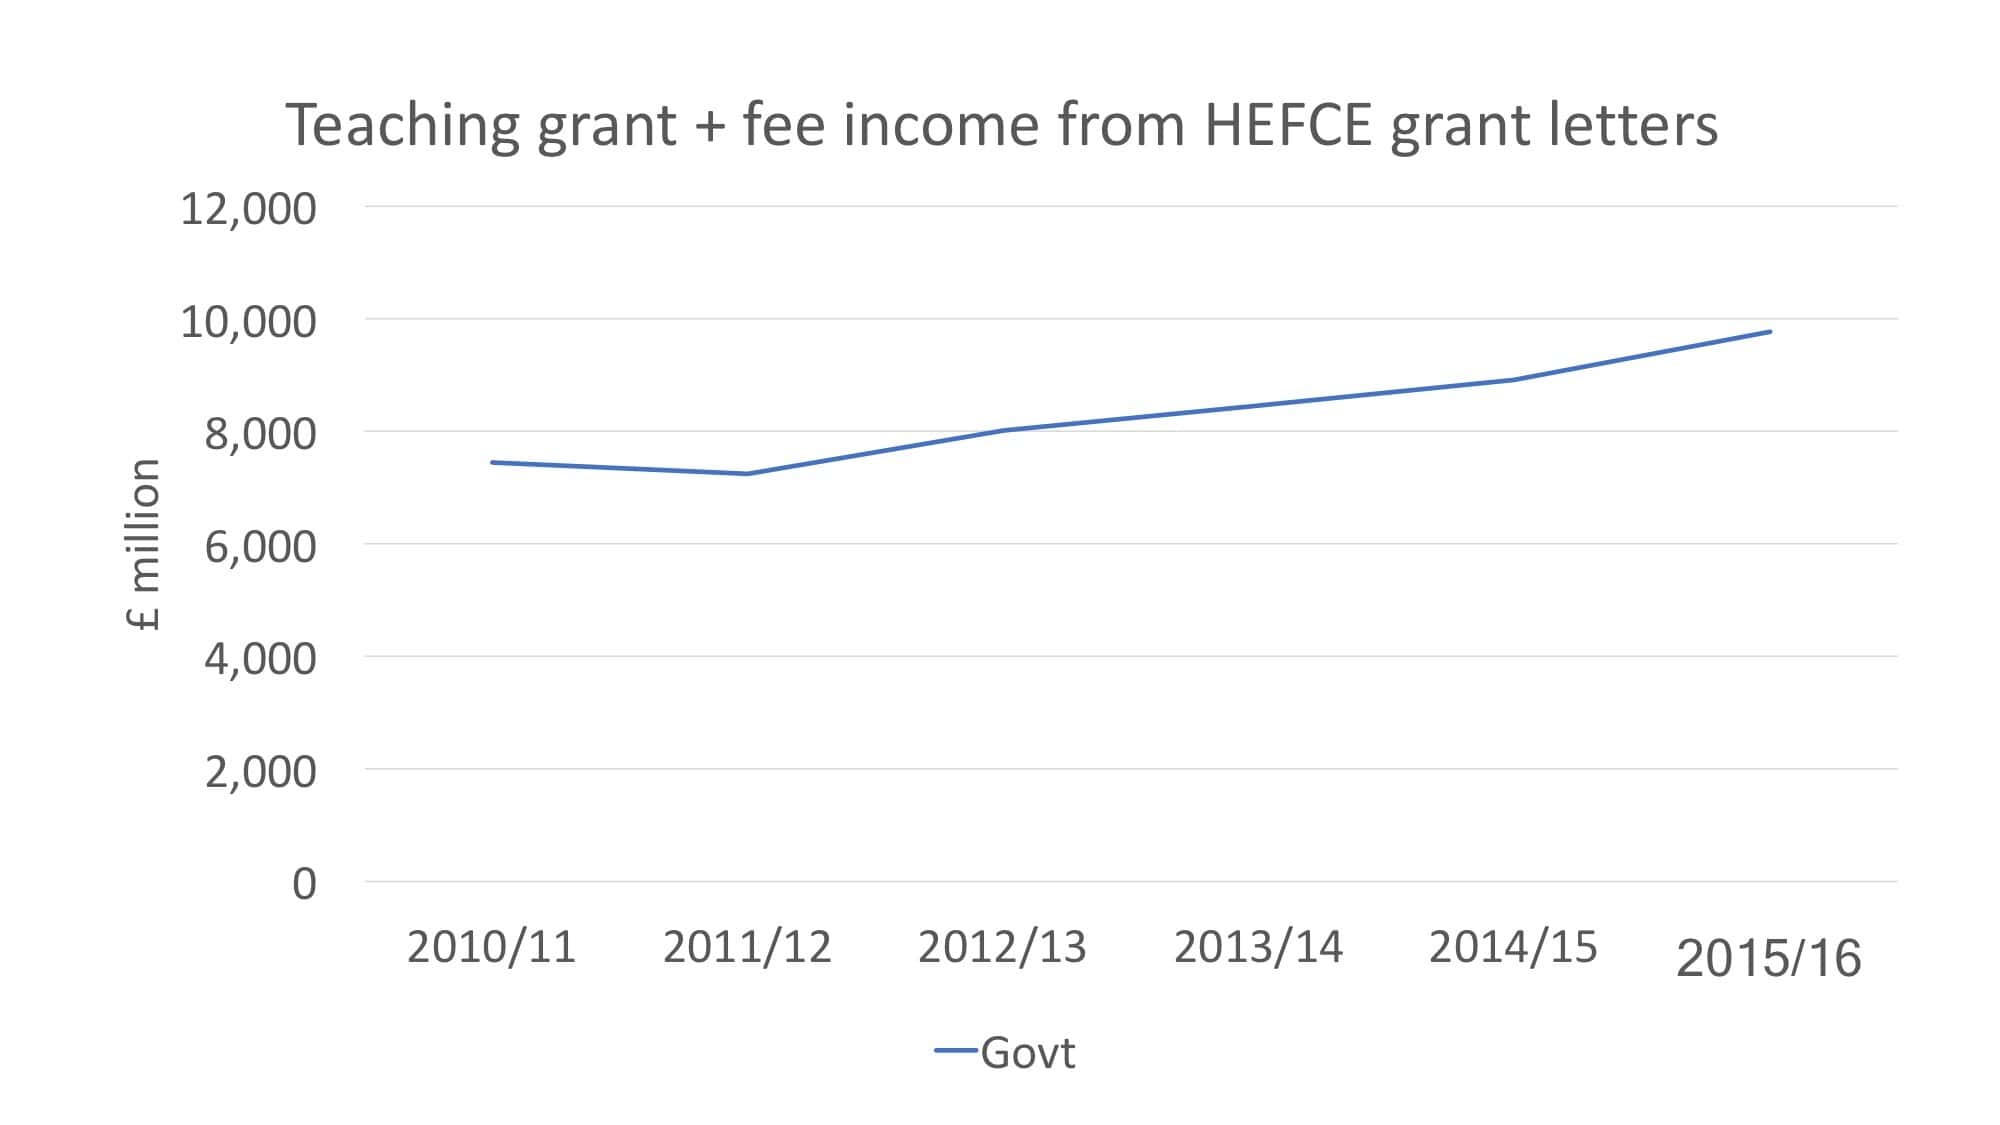
But the same data can be presented in other ways that show a gradual incline rather than repeated step changes. This second chart shows the total funding received by higher education institutions in England for teaching home and EU students, which is made up of the HEFCE teaching grant and tuition fee income, as shown in the annual grant letters from the Government to HEFCE.
Another reason why I think changes in the funding of universities have been exaggerated is that the post-2012 change were more evolutionary than revolutionary. I wish I had £1 for every time I have read that the Coalition introduced a higher education bill in 2010 to triple fees. That was not necessary because Tony Blair’s legislation had such inbuilt flexibility and just need some changes to the figures in secondary legislation, making it a short and less painful procedure. I am tempted to say, if you want to know what a radical approach to higher education looks like, you shouldn’t look at the Coalition’s reforms but at the current Government’s plans.
Having said that, the Coalition made one change that was more important than the tripling of tuition fees. The abolition of student number controls allows universities to recruit as many students as they like and is having a dramatic impact on individual institutions. The policy remains the one I am proudest to have worked on because it has changed behaviour in profound ways.
The IFS confirm the removal of student number controls could lead to an increase in students of 20% and they worry that spending at this rate could eventually pose a ‘risk to the public finances.’ If that is so, it is unlikely to be on the Government’s radar for a while because student loans do not contribute to the figures for the deficit on which Ministers want to be judged.
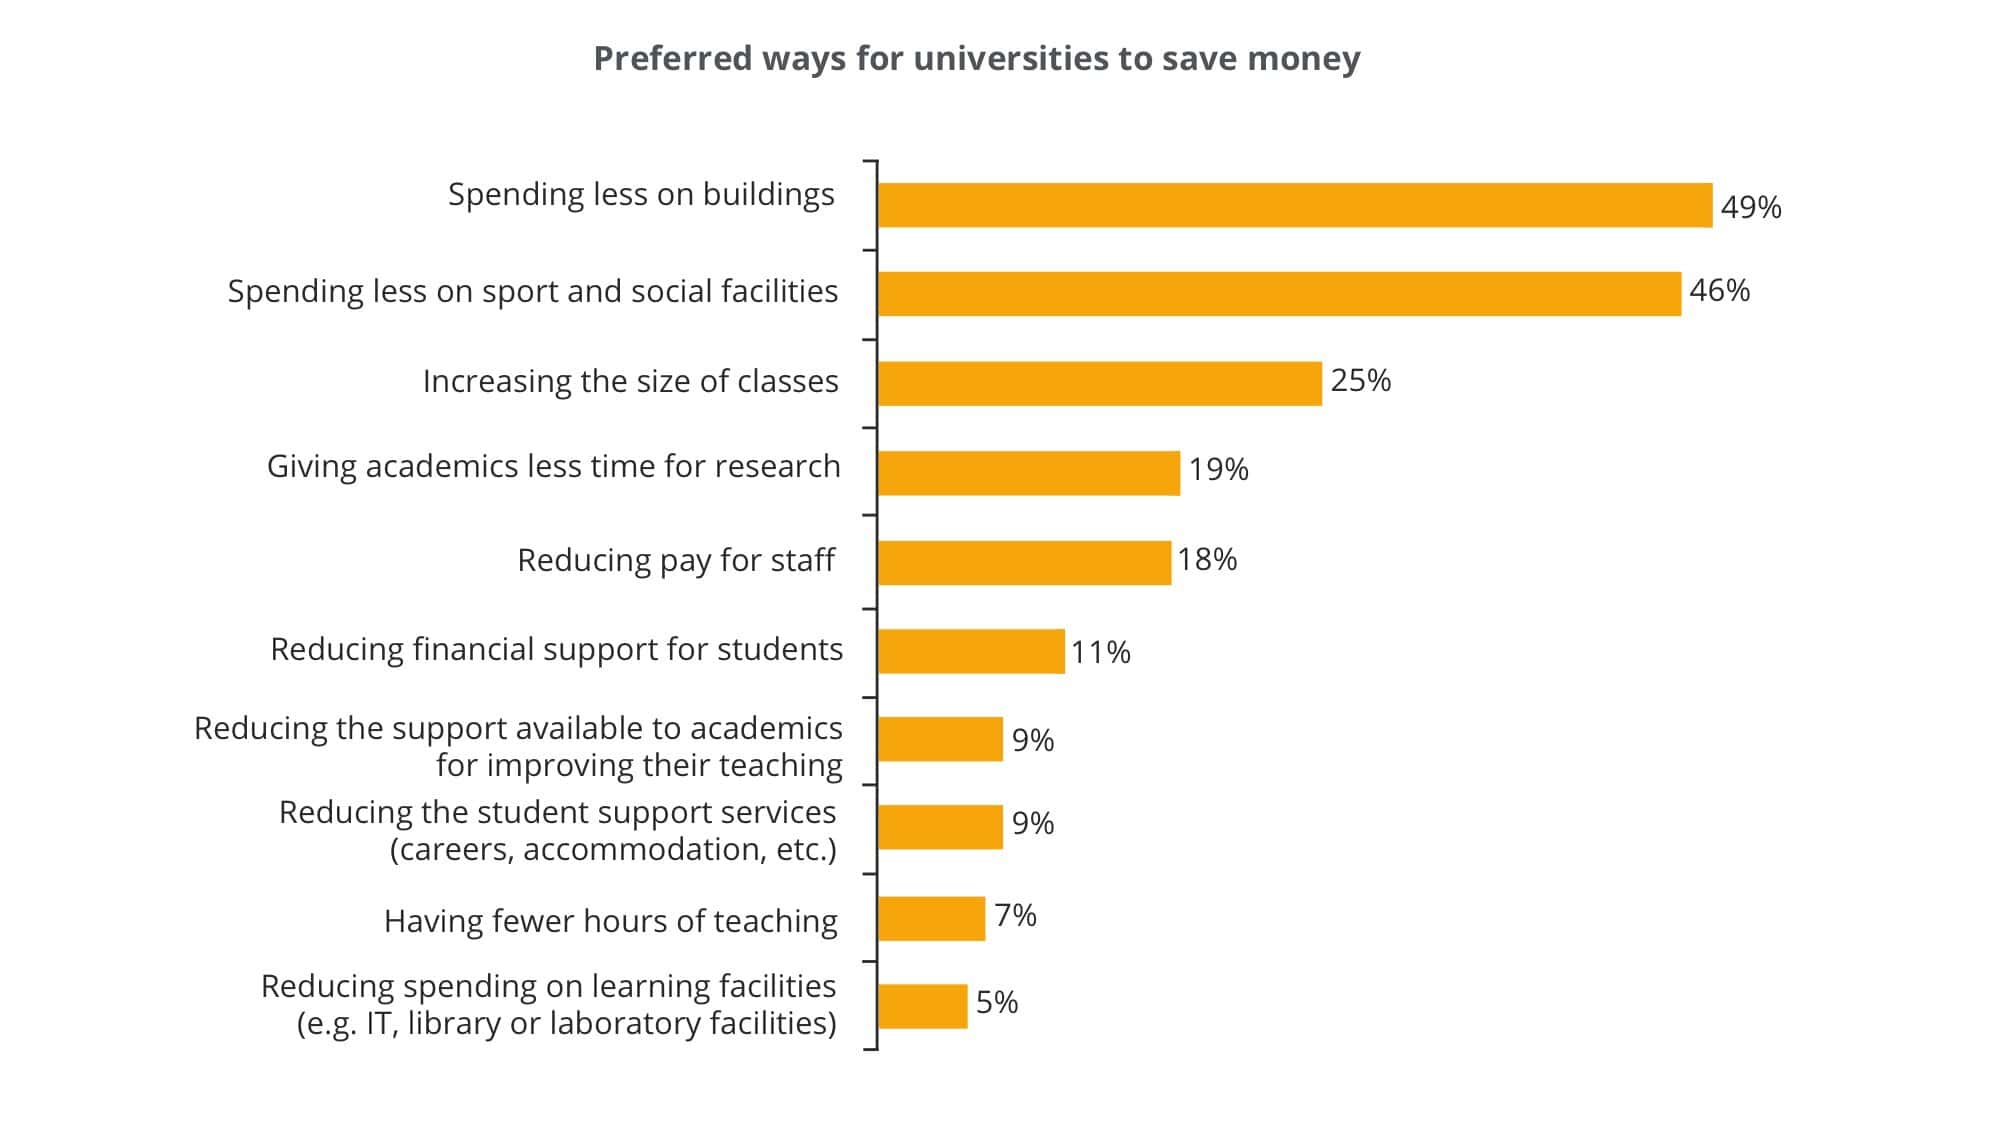
For now, I am more worried about something else: whether the available spending is going on the right things. Our campuses are dotted with the most fantastic facilities for research, teaching and learning and social activities. That may be for the best, indeed it may be the reason why our higher education system continues to be so world class – although our HEPI / HEA surveys suggest current students see new buildings as a lower priority.
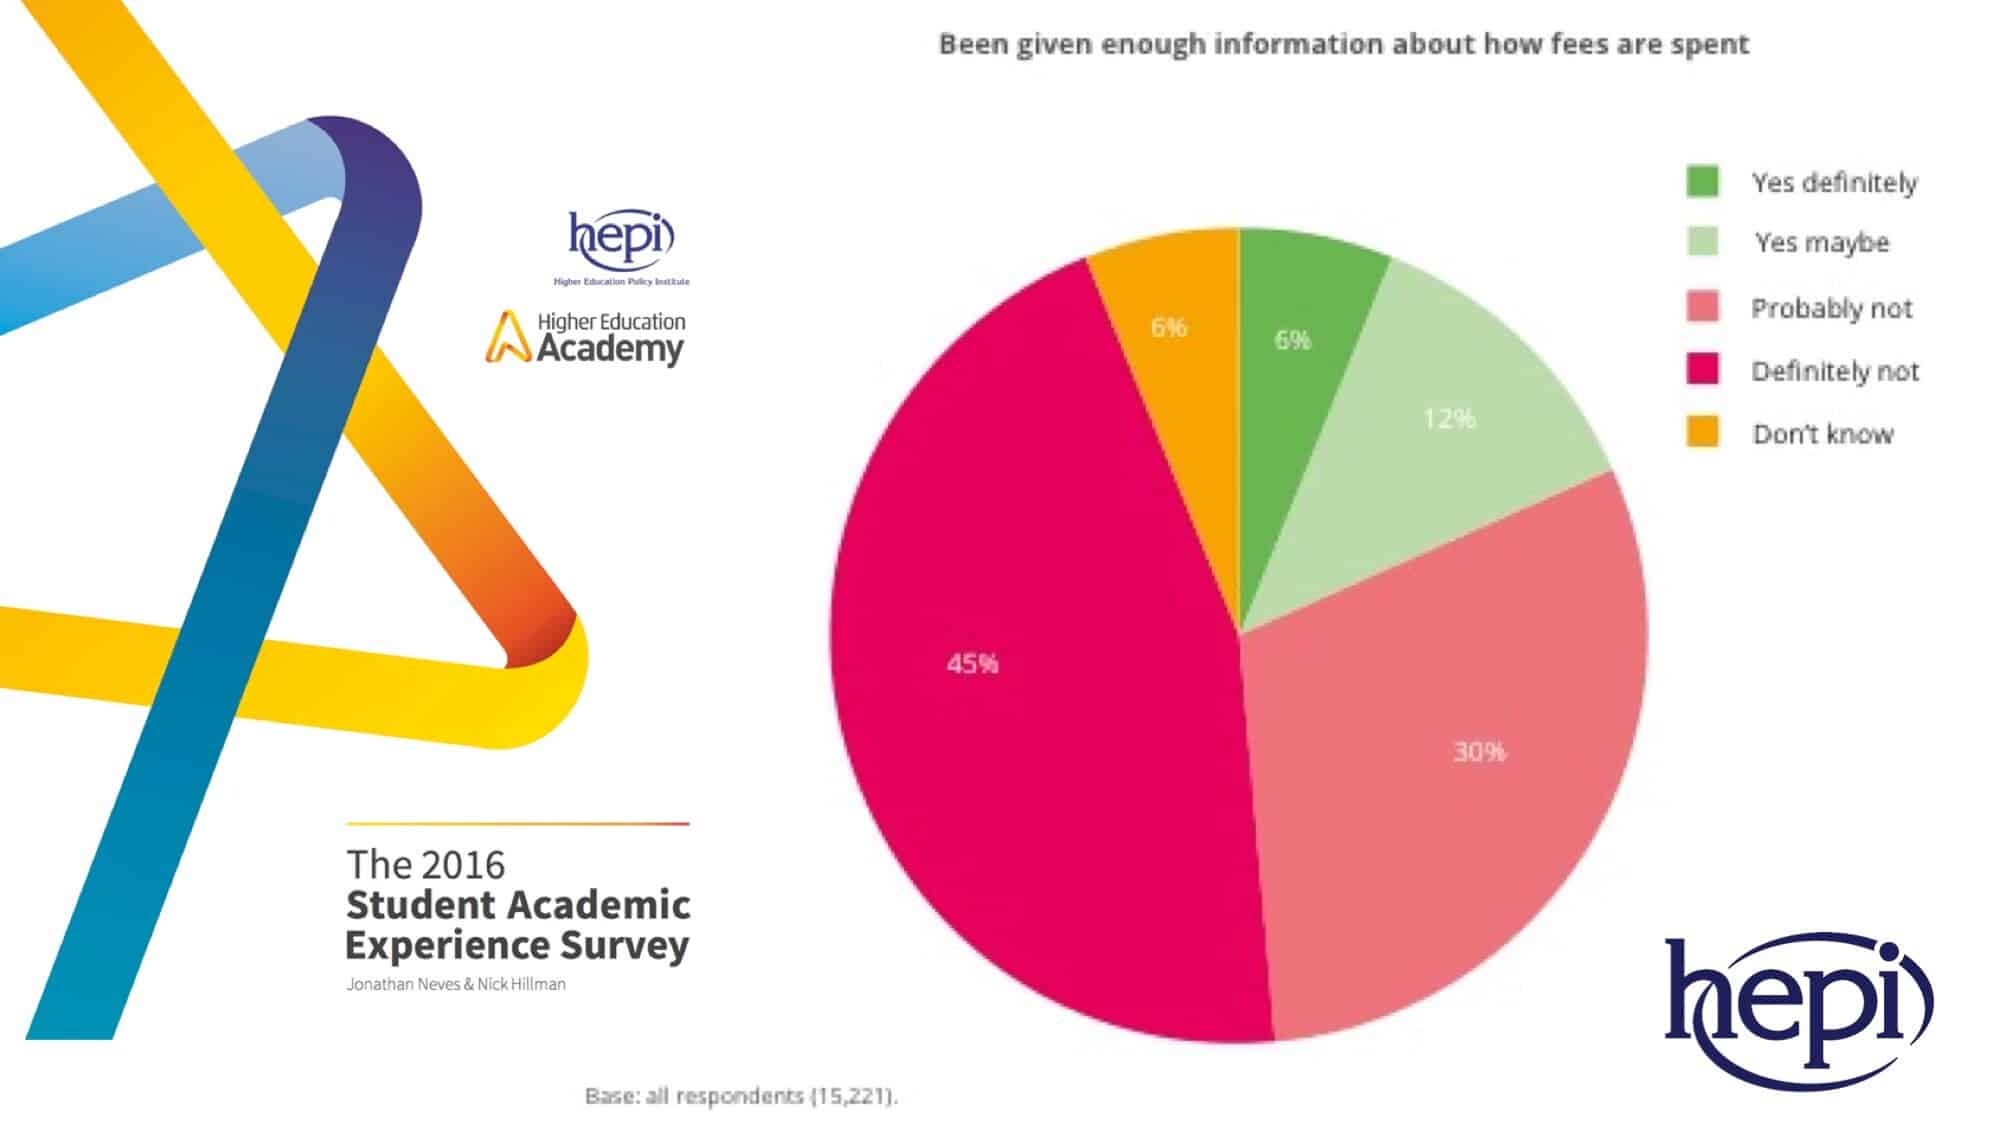
Our survey has also shown for two years running that three-quarters of students want to know more about where their tuition fees go. Universities have yet to grapple sufficiently with this challenge in my view – although the new expectation that higher education institutions should sponsor state schools has led to more interest in explaining where tuition fee incomes goes.
Finally, while wholeheartedly welcoming today’s report, I do think we now need to consider putting the results in an international context. While the IFS report shows we have changed our priorities as a country over time, the OECD data show our competitors do things in different ways: they spend less on education and spread the available resources in different ways.
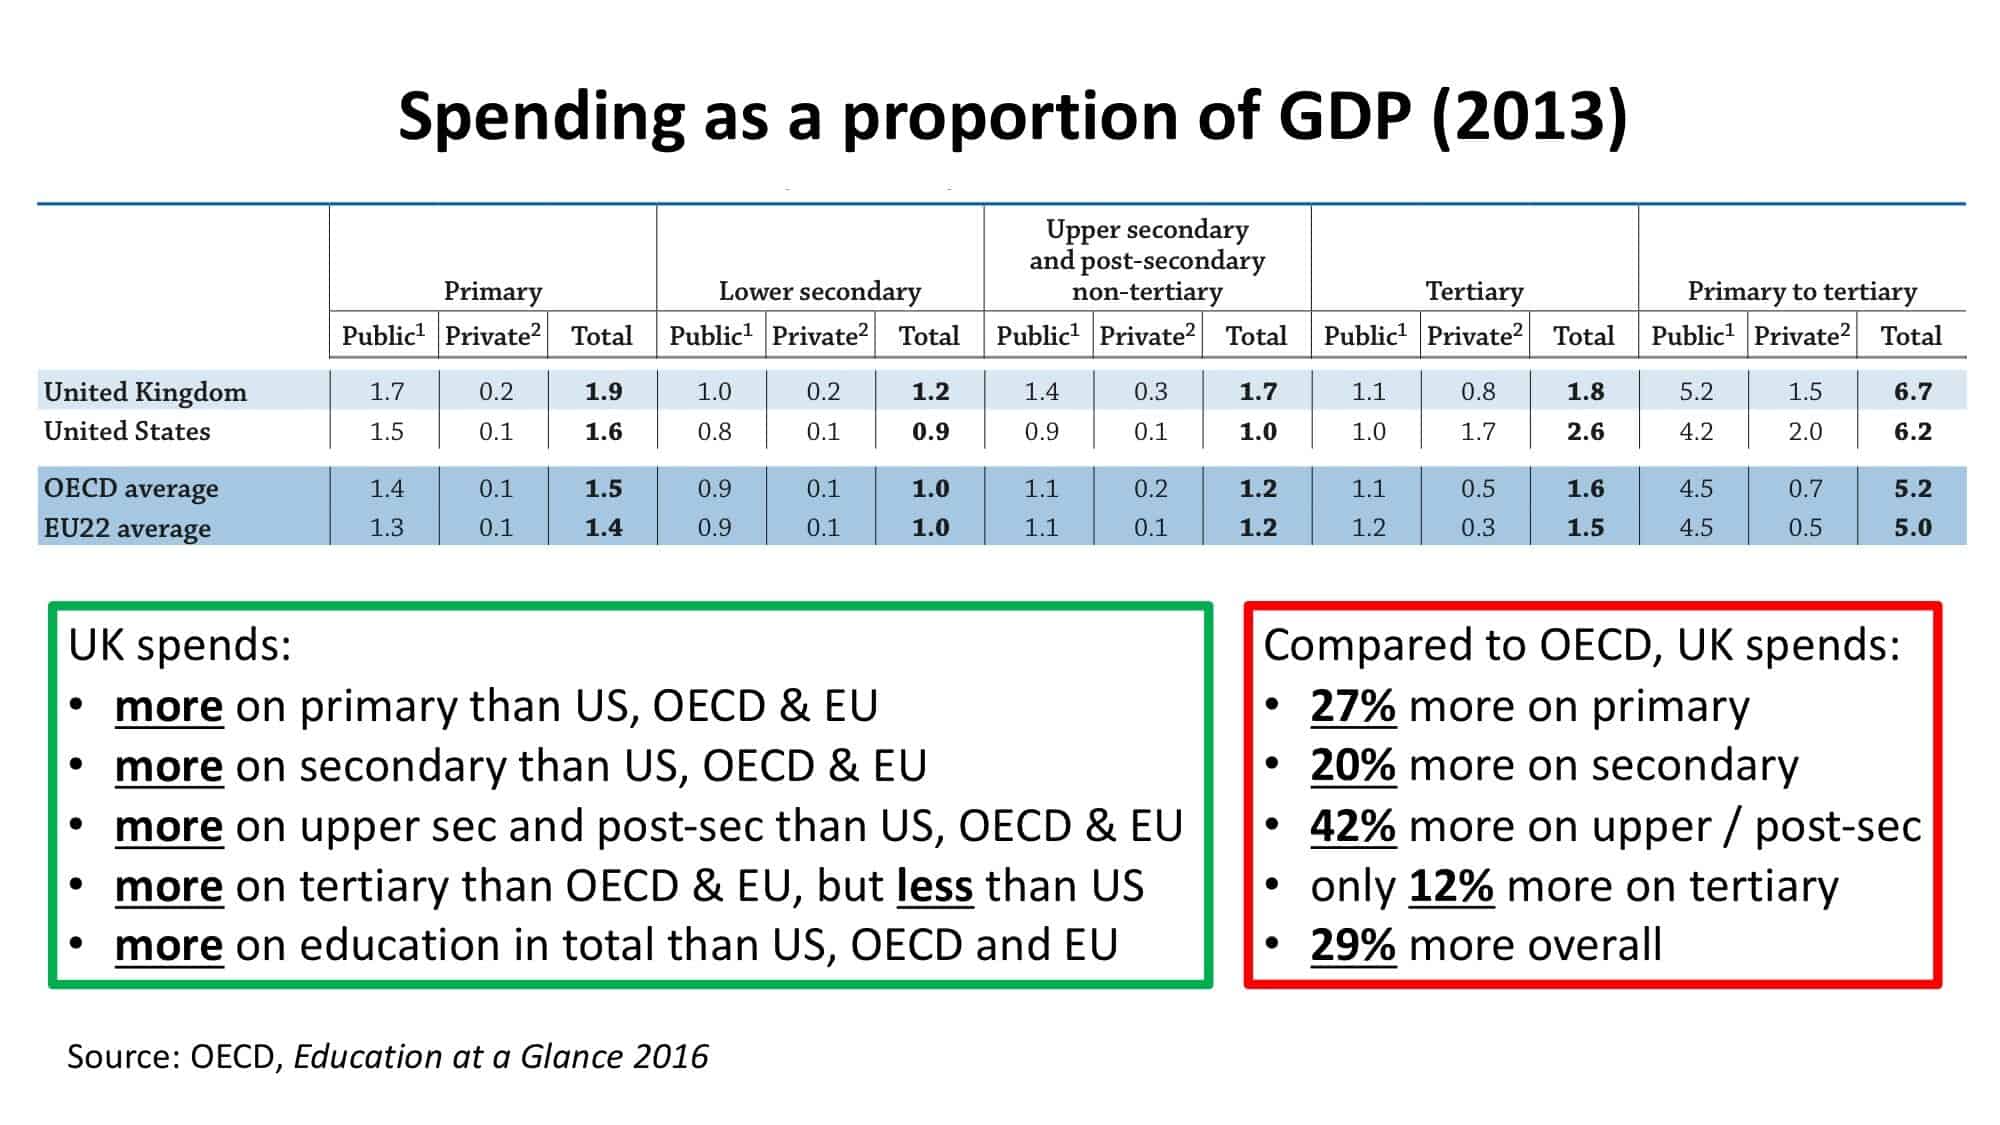
There isn’t time to go into this data in any great detail and I am not sure I know enough about the OECD’s classifications to do so in a particularly useful way. But, before we consider changing our commitments on the basis of the IFS’s historical data, we should perhaps look at how generous we are towards different parts of the education system when compared to our main competitors.

Comments
Add comment