1 school exam grade in 4 is wrong. That’s the good news…
This guest blog has been kindly contributed by Dennis Sherwood, an independent consultant.
In my HEPI blog of 15 January, I presented evidence to show about one school exam grade in every four, as awarded each August, is wrong. That matters.
Life-changing judgements – university admissions (or not), apprenticeship places (or not), the need for a re-sit (or not) – are being made on the basis that a candidate is awarded a 3 or a 4 at GCSE, or a B or an A at A-Level. But if the 3 should have been a 4, or the A should have been a B, then such judgements and decisions are being taken on thin ice.
More subtle things can happen too: what, for example, is the effect of an incorrect GCSE grade on a candidate’s predicted A-Level grade? Might an erroneously low GCSE grade erode a candidate’s self-confidence, and set up a self-fulfilling prophecy of failure?
Reliable grades matter, and Section 22 of the Education Act 2011 places a statutory duty on the regulator to deliver them:
The qualifications standards objective is to secure that – (a) regulated qualifications give a reliable indication of knowledge, skills and understanding
Is this duty being fulfilled?
My claim that about one grade in every four is wrong is an average over the whole cohort, and so this blog looks more deeply, asking: ‘How reliable are the grades awarded to individual candidates?’ This question is important, for it is the destiny of the individual, not the cohort, that is on the line. And as you will see, an average of one wrong grade in four is the good news …
Let me first summarise my previous blog. The evidence that about one grade in four is wrong comes from a report published by the school exam regulator, Ofqual, on 27 November 2018. This presents the results of a study on a large number of blind double-marked GCSE, AS and A-Level exam scripts. It addresses the question: ‘If the entire subject cohort’s scripts were to be fairly re-marked by a senior examiner, for what percentage of scripts would the grades corresponding to the marks given by both examiners be the same?’ In essence, this is a definition of the reliability of school exam grades, and Ofqual’s document is the first time that measures of grade reliability have been published.
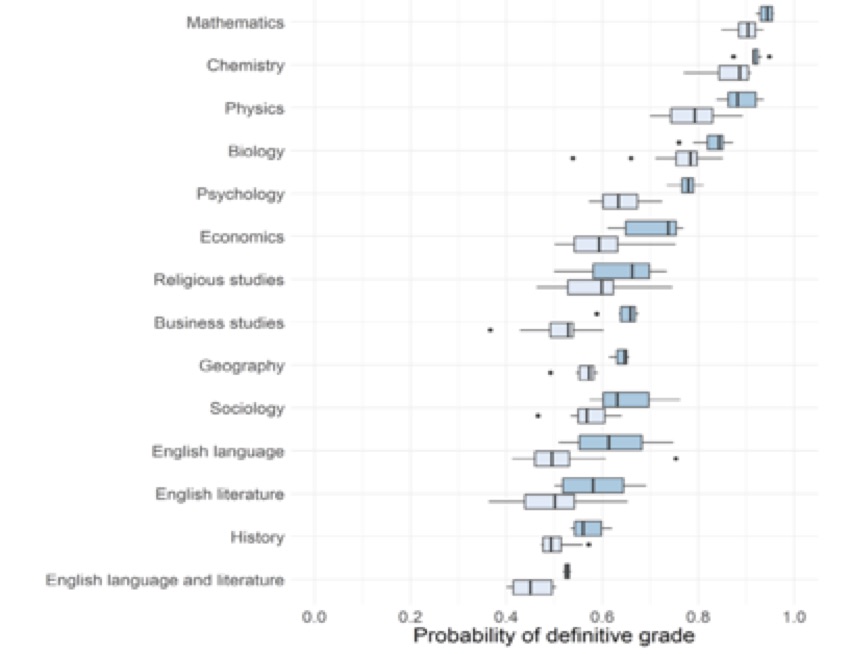
For each subject shown in this chart, the measure of grade reliability is shown by the heavy vertical black line within the darker blue box. So, for English Language, this line is at 0.61 = 61%. This implies that about 61% of the entire cohort’s scripts, when fairly re-marked by a senior examiner, would have their originally-awarded grades confirmed. The grades originally awarded to the remaining 39% would be changed. Since the grade associated with the mark given by a senior examiner – referred to by Ofqual as the ‘definitive’ grade – is, by definition, ‘right’, then – on average – across GCSE, AS and A-Level English Language, about 39% of the originally-awarded grades must be wrong.
To make that real, the annual cohort for GCSE English Language is about 700,000. The number of wrong GCSE English Language grades is therefore more than a quarter of a million every year.
Figure 12 above gives measures of grade reliability for 14 subjects, including:
- Maths (all varieties), about 96% right, 4% wrong
- Biology, about 85% right, 15% wrong
- Economics, about 74% right, 26% wrong
- Religious Studies, about 66% right, 34% wrong
- History, about 56% right, 44% wrong.
Weighting each of the 14 subjects by the corresponding cohort gives an average reliability of about 75% right, 25% wrong. Hence my statement that, on average, about one grade in four is wrong.
Why are grades so unreliable? Not because marking is sloppy, but because marking is not precise. A script does not have a single precise mark of 54. Rather, different examiners can legitimately give the same script (slightly) different marks. So the range of marks for that script might be 53, 54 and 55. If these three marks lie within the same grade width, then all result in the same grade. But if the 5/6 grade boundary is 55, then marks of 53 and 54 are grade 5, but 55 is grade 6. One mark can, and does, make all the difference.
A fundamental truth is that all marking is ‘fuzzy’. And when a fuzzy mark straddles a grade boundary, the corresponding grade must be unreliable. And we all know that some subjects – say, History – are intrinsically more fuzzy than others, such as Maths. We would therefore expect History grades to be less reliable than Maths grades, as indeed is verified by Ofqual’s results: History, about 56%; Maths, about 96%. As a consequence, the measurement of fuzziness for History will be a bigger number than the corresponding measurement for Maths. In the example of the previous paragraph, the marks 53, 54 and 55 span a range one mark either side of the central mark 54; for a fuzzier subject, the range might be from 49 to 59, five marks either side of the central mark 54.
The discussion so far has been about whole cohorts, and averages across the entire mark range. But what is the reliability of the grade associated with a specific mark, say 54? That, of course, is the key question for an individual candidate. The answer, for AS History, will be found in Figure 11 of the Ofqual report, reproduced (with some additional annotations) here.
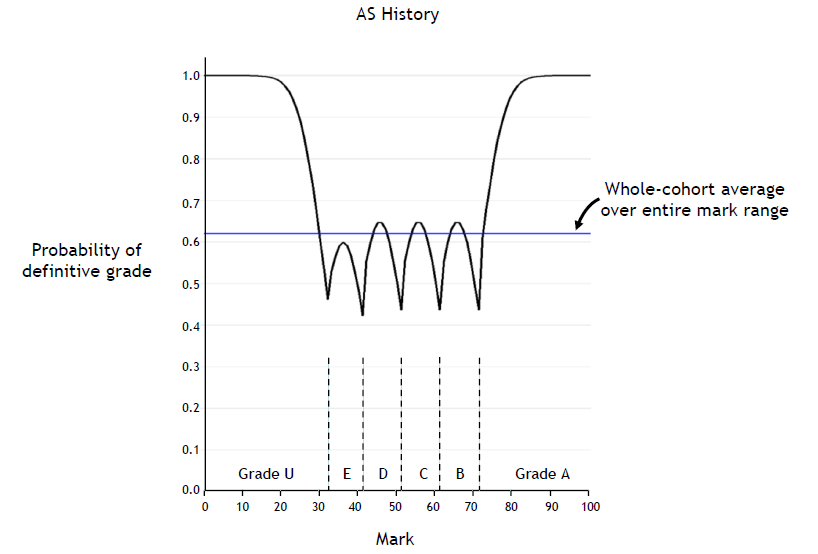
The horizontal axis represents the range of all marks, standardised from 0 to 100. This exam is graded A, B, C, D, E, U, and the grade boundaries correspond to marks as shown.
The vertical axis represents grade reliability, expressed as a probability, on a scale from 0.0 to 1.0, corresponding to percentages from 0% to 100%.
The horizontal line at about 0.62 (or 62%) shows the whole-cohort average over the entire mark range. This value is different from the value of 56% for the average reliability for History, as shown in Figure 12 of the Ofqual report: 56% is an average over the total cohorts of GCSE, AS and A-Level, whereas 62% is the average for AS only.
The ‘wiggly line’ answers these two equivalent questions:
- What is the probability that a script given a specific mark is awarded the ‘definitive’ grade?
- What percentage of all scripts given a specific mark will have the original grade confirmed if all those scripts were to be fairly re-marked by a senior examiner?
If grading were fully reliable, this chart would show a straight horizontal line, at a probability of 1.0, 100%, for all marks. As can be seen, the only marks for which the corresponding grades are fully reliable are those greater than about 85 (good As) or less than about 20 (poor Us). All other marks are unreliable to a greater or lesser degree.
This chart shows a number of important features:
- The grade boundaries are clearly visible, and for marks at, or very close to, any grade boundary, the probability of being awarded the right grade is less than 50%. Pause for a moment and think about that. It means that it is more likely that the wrong grade will be awarded than the right one. Tossing a coin would be more fair.
- For many of the marks associated with the intermediate grades B, C, D and E, corresponding to most of the candidates, the probability of being awarded the right grade is less than the whole-cohort average.
- The intermediate grades B, C, D and E are most reliable at the centre of the grade width, as shown by each ‘peak’, and increasingly less reliable towards either grade boundary.
- The maximum reliabilities of grades B, C, D and E are all significantly less than 100%, implying that there is no mark – not even the mark at the centre of the grade width – that corresponds to a fully reliable grade. This implies that the fuzziness associated with this central mark, which is necessarily symmetrical, cannot lie wholly within the grade width but must extend beyond, and straddle, both grade boundaries simultaneously.
- If a script marked at the centre of, for example, grade B, is fairly re-marked, there is a probability of about 35% (that’s about 1 chance in 3) that the grade will be changed – even though the mark is as far from a grade boundary as possible. Because the fuzziness straddles both the B/A and C/B grade boundaries, the grade change might be to an A. But it is just as likely to be a C. This is consistent with the statement, on page 4 of the Ofqual report, that grades are reliable one grade either way, as discussed in more detail in my previous blog.
- Grade A approaches 100% reliability at about 85 marks – this being some 13 marks higher than the B/A grade boundary, at about 72 marks. This provides an estimate of AS History’s fuzziness, suggesting that the overall fuzziness associated with any mark – say 54 – might be represented as 54 plus or minus 13 (yes, 13). This estimate is confirmed by the number of marks between the U/E grade boundary (about 33 marks), and the point at which grade U becomes 100% reliable (about 20 marks). It is also consistent with the inference that the end-to-end fuzziness, now estimated as 2 x 13 = 26 marks, is greater than each of the B, C, D and E grade widths.
- The maximum grade reliability associated with each of grades B, C and D is the same, and greater than the maximum grade reliability of grade E. Also, careful measurement will show that grades B, C and D are of the same width (10 marks), but grade E is narrower (9 marks). This is a particular instance of the general rule that the wider the grade width, the more reliable the grade. Conversely, the narrower the grade width, the less reliable the grade.
This last point has particular relevance to the recent change in the GCSE grading structure from A* to G (plus U) to 9 to 1 (plus U). By policy, the old C/D boundary is pegged to the new 4/3 boundary, implying that the six new grades 9, 8, 7, 6, 5, 4 occupy the same total width as the four old grades A*, A, B, C. The average grade width has therefore become narrower. As a consequence, GCSE grades have become more unreliable.
That may be disturbing news to us, but it cannot be news to Ofqual: here is an extract from page 21 of an Ofqual report published in November 2016, before numeric grades were first implemented: ‘Thus, the wider the grade boundary locations, the greater the probability of candidates receiving the definitive grade. This is a very important point’. It seems that the reduction in GCSE grade reliability has happened, if not deliberately, at least knowingly. That puzzles me. What is the point of increasing the number of grades when you know that those grades will become (even) more unreliable?
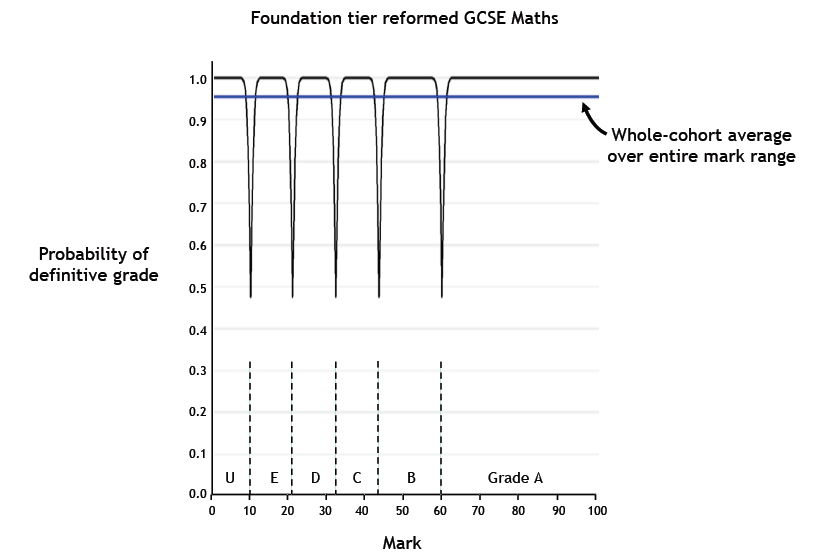
The chart shown in this blog refers to AS History, and, as shown in the first chart, History is one of the least reliable subjects. All the features identified, however, apply to measures of grade reliability for all subjects, at GCSE, AS and A-Level, and for any number of grades of any widths. All charts will show a wiggly line, with minima at the grade boundaries, and maxima at the centre of each intermediate grade, but the probabilities associated with those minima and maxima will vary according to the subject. For Maths, for example, the mid-grade maxima will reach 100%, but the minima still dip towards 50% at the grade boundaries, as shown here for foundation-tier reformed GCSE Maths, graded A, B, C, D, E, U.
For some other examples, see Figures 6 and 9 in Ofqual’s recent report, and also Figure 13 on page 24 of Ofqual’s November 2016 report (but make sure you are sitting down when you do – especially ‘unit 5’).
I consider charts of this type to be much more informative than whole-cohort averages. Each year, Ofqual publish a large number of statistics, but none refers to arguably the single most significant characteristic of the grades awarded – their reliability. This information is important. In its absence, it is not unreasonable for any user of exam grades to assume that grades are reliable, that a B is indeed a B. Universities, colleges and employers all take decisions in good faith. But as we have seen, Ofqual’s own data show that many grades are not reliable at all, especially grades corresponding to marks at, or close to, any grade boundary – grades that are only about 50% reliable at best.
In my last blog, I put the case that grades should be scrapped, but while they are being used, measures of grade reliability – by mark, for each subject, and for each exam board – should surely be published.
This is not a new idea. In 2005, the exam board AQA published a document, in which, on page 70, we read:
However, to not routinely report the levels of unreliability associated with examinations leaves awarding bodies open to suspicion and criticism. For example, Satterly (1994) suggests that the dependability of scores and grades in many external forms of assessment will continue to be unknown to users and candidates because reporting low reliabilities and large margins of error attached to marks or grades would be a source of embarrassment to awarding bodies. Indeed it is unlikely that an awarding body would unilaterally begin reporting reliability estimates or that any individual awarding body would be willing to accept the burden of educating test users in the meanings of those reliability estimates.
Indeed so. Nobody likes to wash their dirty linen in public. But if the exam boards are reluctant, what is the role of the regulator? Why has the regulator not been publishing reliability measures for years?

Comments
Christopher Lunt says:
Fascinating research – this really demonstrates the importance of utilising best practice in assessment. The cost of not crafting sound assessment methods, especially for high stakes decisions, is too high to ignore.
Reply
Nigel Bubb says:
Yes it demonstrates the importance of using the most appropriate assessment tool. It also questions the insistence of some QA processes of imposing a grading spectrum on to knowledge & skills that are basically binary. It is useful analysis and opens questions of interexaminer reliability and brings to a head the uncertainty (often referred to, incorrectly, as error) of measurement which exists in any measurement.
Reply
Add comment