Mind the gap: gender differences in higher education
International Women’s Day always offers a good opportunity to reflect on how far we have come and how far we still have to go when it comes to equality between the sexes.
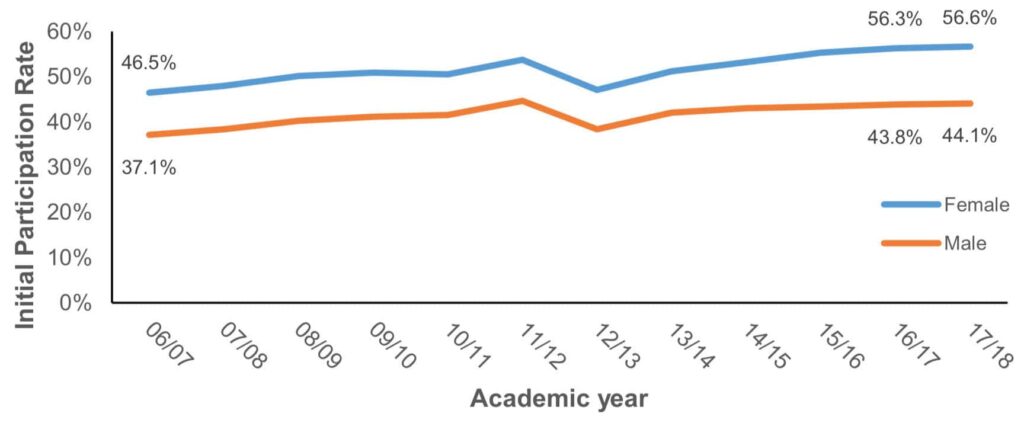
In fact, there is a positive story to be told when it comes to women’s place in higher education. The higher education participation level for young women has now reached 56.6%, compared to only 44.1% for young men. We have previously written about this gap and underachievement by young men in higher education. While this topic garners a great deal of controversy, it is one we must seek to address in striving for equality.
However just looking at participation levels does not show the full picture. There are still significant gender differences between subjects, for example women are much less likely to study most STEM subjects.
Given women’s high levels of participation in higher education, we might expect female graduates to have greater opportunities when they go into the workplace. However last week’s report by the Institute for Fiscal Studies, looking at lifetime returns from higher education looking at graduate earnings, showed the picture to be more complex. 85% of women gain ‘positive net lifetime returns’ from higher education, compared to only around three quarters of men. On average, a university education leads to an increase in net earnings of about 20%. But the difference between male graduates and female graduates is stark: the estimated gain to the exchequer of individuals attending HE is around £110k per student for men and £30k per student for women.
There remain a variety of explanations for the gender pay gap: women taking time out to have children, occupations which receive lower pay often being dominated by women and, in some cases, companies continuing to pay women less for the same work. This highlights the difficulty with assuming the influence universities can have on their Longitudinal Educational Outcomes (LEO) data: Cranfield University, where the student body is 74% male, may have very different earnings data to Bishops Grossteste, where the student body is 80% female. It also shows the risks of using LEO data to classify which courses are ‘low quality/value’. There may be courses which appear to offer poor returns when looking at averages, but in which women still see higher salary returns than non-graduates. That is without considering the wider benefits offered beyond earnings.
Looking at these averages alone still doesn’t provide a full picture. We know when other characteristics intersect with gender, such as ethnicity, sexual orientation and disability, the gap grows even wider. Similarly, this does not even start to look at the gender differences seen in university staff, where women make up 55% of the total staff population, but only 29% of Vice-Chancellors and 37% of senior leadership teams. The gender pay gap of staff in universities is 15.9%, compared to the median level of 9.7% in other sectors.
We have made great steps in the proportion of women now entering higher education and achieving academically. It is clear, even if only looking at the economic returns, that it is valuable for women to go on to higher education. But it is also clear that the labour market they go on to enter still has a long way to go in terms of equality, even when looking at universities own labour force.
For International Women’s Day in previous years, HEPI has written about gendered data bias (2019), sexual harassment in higher education (2018) and the challenges facing female academics (2017).
The below table takes the latest HESA staff and student data, to show the gender make up of universities across the UK.
[table id=1 /]


Comments
Pete says:
The blog raises an interesting question.
Is the right answer to e.g. graduates from working-class background, those from some ethnic minorities and those from “left-behind towns” doing less well in the labour market than similarly qualified white middle-class graduates in the southeast to restrict the number of people from these backgrounds who can access those qualifications?
Is that effectively what we’re going to end up with given the likelihood of simplistic LEO-based metrics determining what a low-value course is?
Reply
Stan says:
Very interesting commentary to the numbers.
Basically the article feels very misandrist. The jest of it is:
“We successfully pushed boys down in education, and the trend for boys participation is going down. But there is more to do – boys still dominate some fields and we must push them down there as well. Boys still manage to outearn girls in the later life, but hopefully if we continue pushing boys down, we can get proper equity”.
How can anyone even talk about helping girls in education when boys are now struggling more?
Reply
Mzich says:
I can’t agree more Stan. Seems like we should be striving for excellence with both genders? I’d like to see numbers closer to 50:50 male:female.
Reply
jeff says:
Very true Stan.
Reply
Esther Jover Lugo says:
Without any intention of coming across as controversial, Stan, I think you are reading it only from your own perspective, a White middle-class man. The question here is why two people that have achieved the same qualification have different retribution
‘the estimated gain to the exchequer of individuals attending HE is around £110k per student for men and £30k per student for women.’
That is the real question.
Reply
Jean-Luc says:
Did anyone consider that this is a meaningless metric? Try to measure “gain to the exchequer” from individuals with brown eyes vs those with green eyes. If you find a difference, is that due to their eye colour?
Reply
william says:
Stan, I feel like you are getting mixed up here, you are saying just because the percent of male that goes to university is going down means that there is less male going. But this is wrong for example if 100 male and 25 female go to university one year that is 80:20 but next year 100 male and 50 female then that is 67:33. That is a smaller percent but the number of males going to university hasn’t changed. You can look at the “Accepted applicants through UCAS ” in 2020 and it shows the amount of male are indeed going up, as well as the female although at a faster rate. Which means male aren’t getting push down as you say, if that was the case you would see a decrease in male going.
Reply
Largo says:
Esther Jover Lugo, you proved Stan’s point with your regurgitation of middle-class feminist woman’s identity politics “rebuttal.”
As for your question, perhaps you should read the next paragraph: more men study STEM than women, women tend to take out to have children, etc. Men and women also have different abilities and capabilities.
Reply
Joe says:
How very sad to see young boys being left behind, I knew boys did worse in school gcse and a levels so it no surprise. It’s a shame this article thinks this something to celebrate. Boys definitely need more support in school and higher education we need to get it as close to 50% as possible.
Reply
Richard says:
I agree with Stan – the thrust of this ‘ideology’ is clearly to reduce the number of males in HE [with no apparent satisfactory end point so we are left to assume it is must be zero?]. Clearly “equality” has nothing to do with it because where are the demonstrations for more males in universities? Why are we still even discussing the myth of the ‘gender pay gap’ long after it has been debunked?
Reply
a says:
@Esther Jover Lugo >The question here is why two people that have achieved the same qualification have different retribution
It is possible that the initial assumption is not right; maybe the qualification is different because the curriculum is different.
The engineering curriculum is difficult, but also useful if you want exploit the laws of nature and the resouces on this planet. It is natural that engineers make money.
Reply
Dave says:
I agree Stan, there is a continued ideology that forces women into HE at the expense of men and will continue to do so. The gender inequality favouring women is clear to see but they continue to pursue because of past bitterness and resentment.
Men, fortunately, are pursuing STEM subjects and are getting paid for it. Men are also going back to traditional professional within the building sector and are out-earning graduates from the start.
Men realised a while ago that Universities aren’t worth it for a lot of subject areas, when will women wake up and realise this fact too?
Reply
dan says:
From experience I have found men and women to operate differently.
I am not saying that women are incapable of higher brain function, but I am saying that from my experience they are more prone to emotional influence.
Reply
Aimee Whitworth says:
Yet women have continue to get better scores in almost any area/level of education. These stats aren’t proof of men being “pushed out” of higher education. If you actually looked into it you’d see that, whilst more and more women are going into HE in recent years, the number of men still in HE is also still rising. People with lower incomes and more diverse backgrounds, including w/c and BAME men, are gradually becoming more interested in university.
Stop manipulating stats to fit your victim mindset, you aren’t a victim of misandry or discrimination just because men are no longer the only ones being catered to.
The amount of grown men in these comments incapable of logical thought is laughable but unsurprising. Grow up and stop blaming your own shortcomings or failure to succeed in HE on women.
Reply
bill says:
I read these comments on this article with great sadness. It has become obvious to me over a number of years that the perceived inequalities that exist in the “market place ” between men and women, is just that. This is about education at its earliest levels. No one seems to have done any serious research in to the Differences between the way young men and young women learn. It is not about equality in the existing work place. It is about successfully educating our children. So what if the work place is unbalanced ( It is ). That surely cant be rectified by legislation. We need to Educate at every level. Society usually can be educated at the point of a gun, but those changes are not permanent. Ultimately it is about the way we educate in the UK. It is a failed system at a ALL levels. Ultimately the education policys of government need to change. The ways we measure success in that system ,need to change, that can only come if we understand what we are trying to achieve ,and right now we dont.
Reply
Douglas Robson says:
Interesting isn’t it. We are committed to finding equity in society. Until males are found to be the victims of inequity, then we should celebrate it.
Reply
Shameena Agrawal says:
I find the aggregates regarding HE data performed by HEPI really useful and I thank you for that, however, I found it quite bizarre that a purely statistical analysis carries such biases and emotional loaded wording. This begs the question: What is the end goal? If your goal is a 50/50 equal gender split between male and female undergraduate rates, then surely you shouldn’t clasify an increase in the gap as a “positive development”? Furthermore, the article is correctly identifying a smaller number of women joining STEM programmes and marking it as an issue that needs addressing, while completely ignoring the even greater gap in favour of women in, for example medicine, or social sciences. The author seems to exhibit a powerful bias, based purely on ideological rather than statistical markers. I would expect greater objectivity from a purposedly impartial think tank, articles such as this are more suitable for publication the likes of “Daily Mail”, or “The Guardian”. I would sincerely hope that HEPI would not continue down a route of ideologism and instead focus on objective analysis, which is, in my opinion, the right direction into truly improving societal standards and promoting equality.
Reply
Bernard Leslie Stewart says:
Of my three children two went to University, the one who studied medicine now has a high paying career job as an A&E Consultant doctor while the one that studied Applied Art is working as a NMW (national minimum wage) carer. One was male and one was female both are according to reports good at what they do, it would be sexist to tell you the pairing off these criteria.
Reply
Mark Tolver says:
Aimee Whitworth: Could you kindly explain your rationale as to why “women continue to get better scores in almost any area/level of education”? You appear to follow up this statement with a ‘rising of all boats’ type of argument that states that more people of diverse backgrounds are going into HE. This appears to be a logically inconsistent statement; it’s like saying 2+2 = apples — it doesn’t actually explain why women would achieve better scores.
Reply
Michael Lush says:
85% of women gain ‘positive net lifetime returns’ from higher education, compared to only around three quarters of men
Would that have been better written
85% of women gain ‘positive net lifetime returns’ from higher education, compared to only around 75% of men
Which seems odd if men are getting paid more
Reply
Guy Christopher Nicholls says:
Just sounds like more feminist misandry. Women are massively overprivileged in attending University so there should be more doing stem. If women wanted to do stem they would choose it. They don’t. They choose lower value less work useful subjects by choice. Maybe we should just send fewer women to University so we have a 50 : 50 ratio. The whole of Primary and Secondary need a massive overhaul to remove any sexist feminist pro women bias and become truly egalitarian. The education sector is heavily overstaffed by female teachers . Some of whom demonstrate an appalling anti male bias.
Reply
Replies
Rose Stephenson says:
Hi Guy, thanks for engaging with this work. You are correct that there is an element of gendered subject choices (for both men and women), and the reasons behind this are interesting and complex. However, on top of this initial ‘occupational segregation’, there are many structural barriers, particularly in higher education, that exacerbate the gender pay gap. You may be interested to read about these in my paper on the gender pay gap; https://www.hepi.ac.uk/reports/show-me-the-money-an-exploration-of-the-gender-pay-gap-in-higher-education/ In particular, this paper outlines why we must look at both sides of the coin – women struggling to access equality in the workplace and men struggling to access equality in parenting – and how and why these two things are linked.
Reply
Josh says:
Absolute joke this is, it’s a classic case of continue to move the goalposts without looking at context. Will be interesting to see what the stats say now, probably even more women in higher education than men
Reply
Add comment