Mark Corver: Predicted grades and university admissions
We have been running a selection of chapters from HEPI’s recent collection of essays Where next for university admissions? , which was edited and introduced by Rachel Hewitt, HEPI’s Director of Policy and Advocacy. Yesterday we shared the chapter by Rebecca Gaukroger, Director of Student Recruitment and Admissions at the University of Edinburgh, ‘Where next for admissions in Scotland?‘.
This blog is the fifth in the series and is the chapter written by Dr Mark Corver, Founder, DataHE. You can find Mark on Twitter @markcorver.
The largest group of applicants to UK universities are UK 18-year olds, some 290,000 in 2020. Though they have several options, the large majority of them — over 97 per cent in 2020 – apply ahead of results to obtain conditional offers for entry. This long-standing system is underpinned by predicted grades provided by teachers. They serve to calibrate applicant and university decisions with the aim that students can end up holding a firm offer for somewhere they want to go without excessive risk of not getting in.
When policymakers think about where next for the university admissions system, their proposals tend not to feature this system of predicted grades. Quite the opposite. The motivation for redesign often seems to ditch them. Two problems are frequently cited. First, that predicted grades are damagingly inaccurate. And, secondly, they are bad for equality because their inaccuracy disproportionately hits those from under-represented backgrounds seeking entry to the most selective universities.
Published data on predicted grades are not as rich as they should be given their importance. In particular, the cross-tabulation of predicted by achieved A-Level points, the Rosetta Stone of the issue, remains unpublished. But there are sufficient data available to demonstrate that these two supposed problems with predicted grades for university admissions are very likely false.
Accuracy
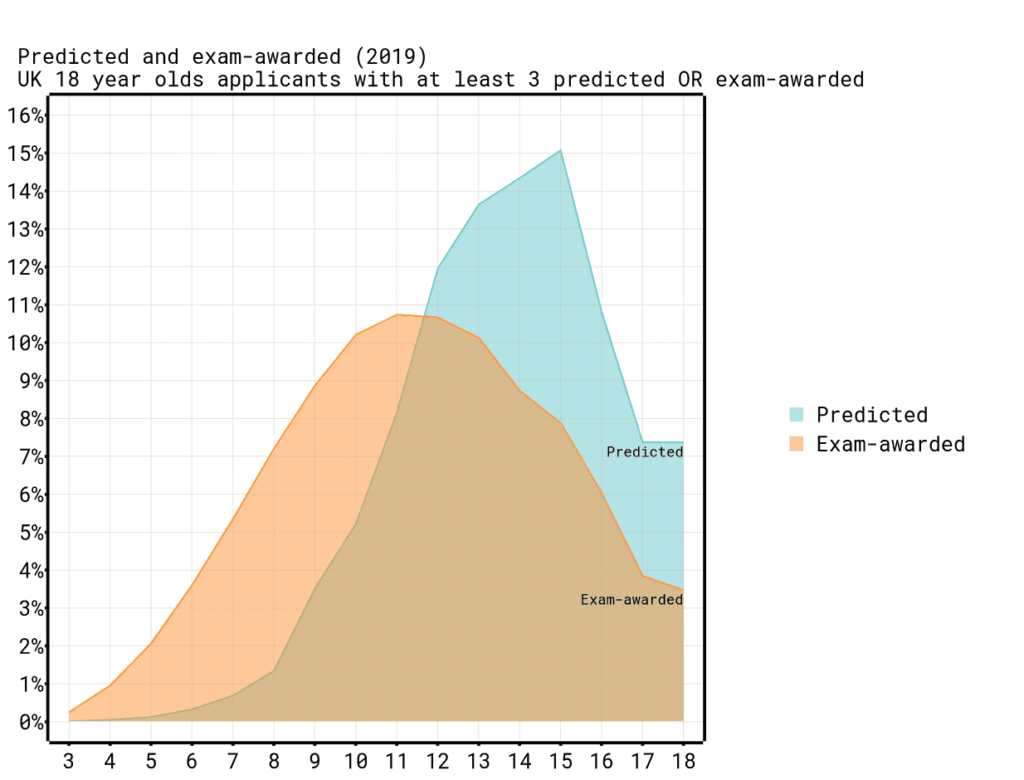
Predicted grades certainly look very different from exam-awarded grades. Figure 1 summarises the best three A-Level grades to points (where a single grade is a point, so AAA is 15, BBB is 12 and so on) to compare predicted with exam-awarded. Predicted points are higher than exam-awarded points. They are also more compressed in their range, squashed up against the A*A*A* (18) limit. Given these differences it is unsurprising that an applicant rarely gets exam-awarded points that equal their predicted points. Just 16 per cent of the time between 2012 and 2017 (before unconditional offers started to affect the patterns), and the exact grade-by-subject profile match would be lower still. The pattern for other qualification types differ, but the poor reputation of predicted grades for accuracy stems from these A-Level properties.
But this perspective does not reflect the role that predicted grades serve in the university admissions system or the realities of exam assessment. Predicted grades are better seen as a reliable estimate of the highest grades an applicant might realistically get through intrinsically uncertain exams.
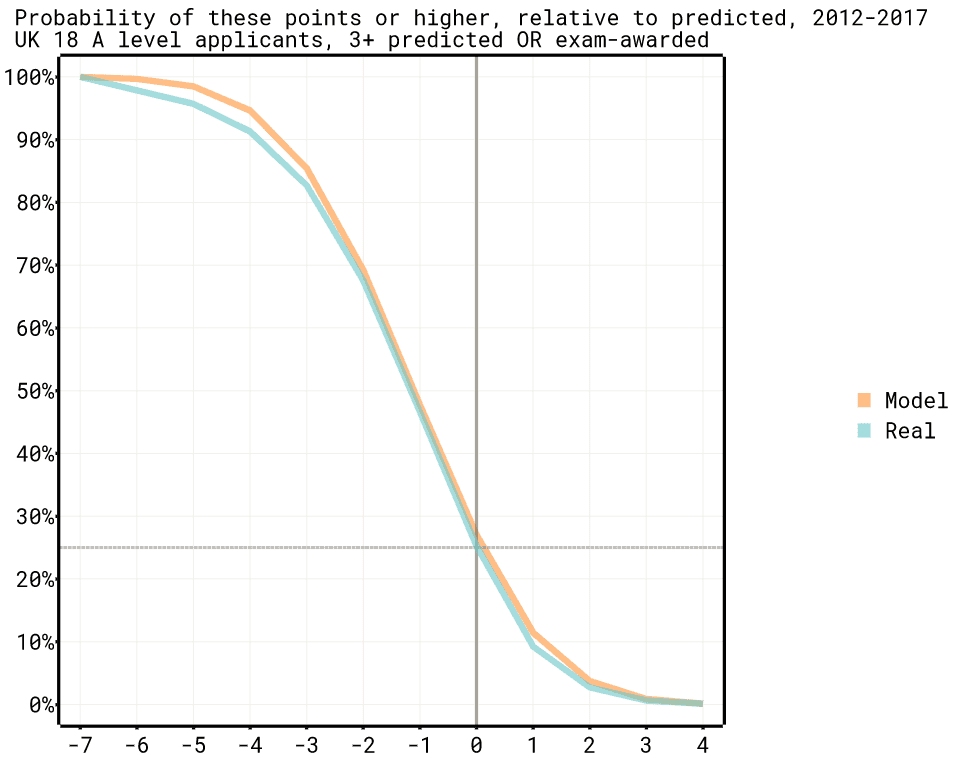
Figure 2 better reflects this perspective by showing the probability of an applicant getting exam-awarded points as high (or higher) relative to their predicted points (again for 2012-2017). It shows that the predicted points themselves (0 on the graph) represent an exam outcome that the applicant will reach or exceed around 25 per cent of the time. They will do better than their predicted points (+1) only around 10 per cent of the time. They will get exam results equal or better than three grades below (-3) their predicted grades around 80 per of the time.
There is more to the predicted and exam-awarded relationship than this. But this distribution is a reliable property of predicted grades that holds across some much more detailed analysis. The closeness of the model line, which shows what the distribution would look like if exam grades followed a consistent normal distribution around each predicted grade value, illustrates this.
So predicted grades are not really a poor estimate of average attainment, more a reliable estimate of something like the upper quartile. They are saying: this student has a realistic chance of doing this well when it comes to exams. If you had to choose a single statistic of potential to underpin good matching of university offers then this would probably be it. That predicted grades are higher than exam-awarded grades is often taken as evidence of their inaccuracy. This is equivalent to saying that an average is not the same as an upper quartile. This is true, but it is not an issue of accuracy. Nor is it a problem for university admissions.
But this does leave a wide range of possible exam-awarded points. Predicted grades are saying: the exam-awarded grades could realistically be this high, but will most likely be a grade or two lower, and could quite possibly be a grade or two lower again. Exam-awarded grades then could range over four points. Not good enough, many might conclude. But this applies all of that uncertainty to shortcomings in the predicted grades. It is unlikely to be this simple.
In 2020 Dame Glenys Stacey, then Chief Executive and Chief Regulator of Ofqual, observed to the Education Committee: ‘It is interesting how much faith we put in examination and the grade that comes out of that […] they are reliable to one grade either way. We have great expectations of assessment in this country’. She probably had in mind here various uncertainties in marking the scripts. But there are other ways that exam-awarded points can fluctuate which have nothing to do with the underlying ability they are trying to measure. You might feel unwell on exam day, for example. But just the supposed marking uncertainty alone puts the random variability of exam results into the territory of plus or minus two points over three A-Levels, similar to their difference around predicted grades. Exam-awarded grades themselves are likely not particularly good at predicting exam-awarded grades.
It is not clear whether the range of exam-awarded points seen for each level of predicted points is due to uncertainty in the predicted grades, the exams, or (most likely) a mixture of different kinds of uncertainty in both. The variation of exam-awarded points about predicted points does not demonstrate predicted grades are inaccurate. It points to the difficulty of capturing what is being measured.
Equality
Even if it seems that, overall, predicted grades might actually be accurate and reliable they could still be an unsuitable basis for admissions if they were damaging to equality. The core concern is that groups who are under-represented in the most selective universities (where predicted grades matter most) might be more likely to have their exam grade potential understated by predicted grades. Such differentially lower predicted grades would deliver a double blow: deterring aspiration in university choices and reducing the chances of getting an offer. This is the reasoning for supposing that switching to an admissions system based on exam-awarded grades only would improve equality. But the data indicates this is unlikely to be the case.
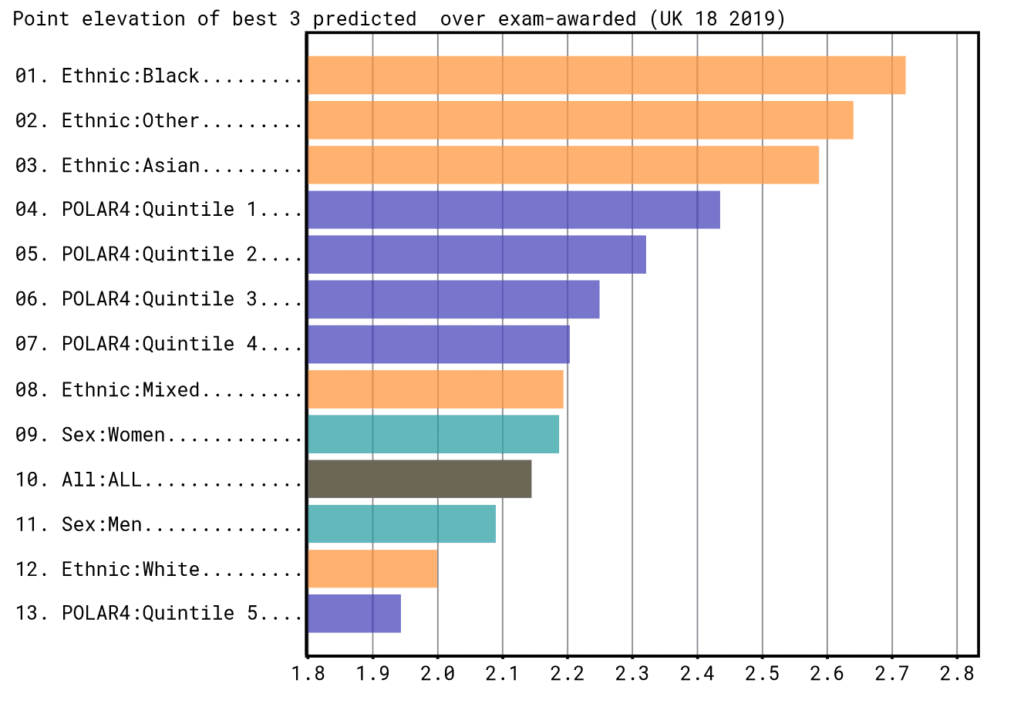
The most under-represented groups in higher tariff universities across the three readily available equality dimensions are POLAR Q1, men and the Black ethnic group. Figure 3 shows how much higher predicted points are over exam-awarded points across these groups. The larger this value the more favourably predicted grades position applicants relative to using exam awarded grades. Two of the most under-represented groups, POLAR Q1 and the Black ethnic group have substantially larger values than average. So, it is unlikely that they would have more favourable admissions outcomes in an exam-awarded only system. Men, the third under-represented group, are slightly below average and so might have a small benefit from discarding predicted grades.
But averages can be misleading. The grade distribution is important too. To account for this, imagine a simplified admissions system where higher tariff universities admit the 30 per cent of 18-year old A-Level applicants who have the highest points. How would the chances of getting in for different groups vary if predicted or exam-awarded points were used as the basis for admissions?
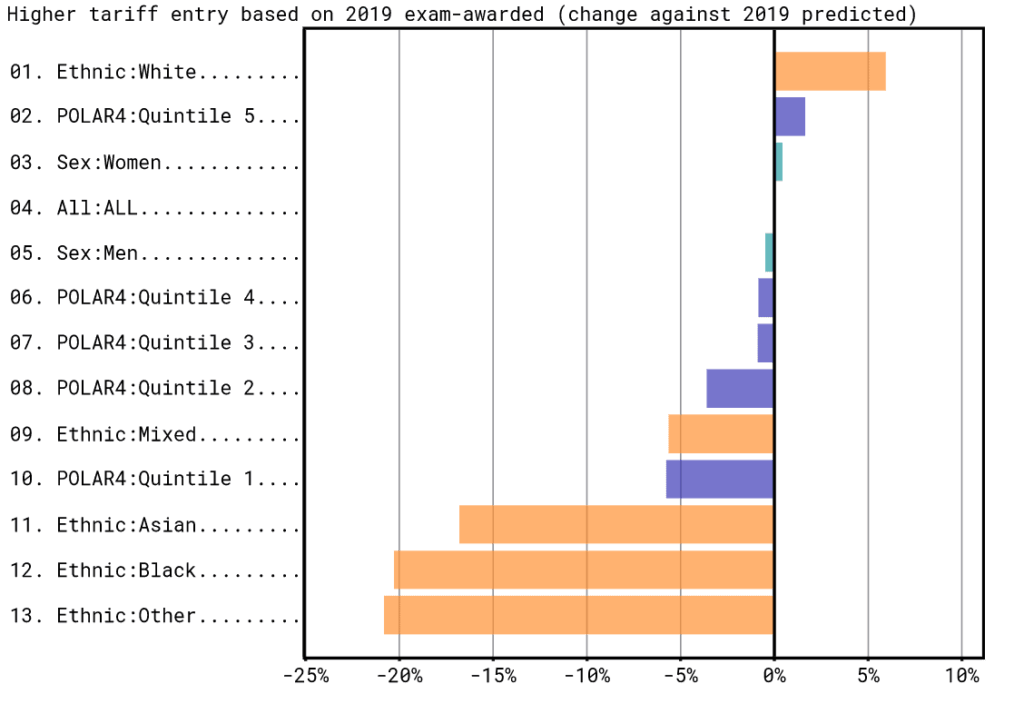
Figure 4 shows how the entry chances for different groups change when the basis for admissions is switched from predicted to exam-awarded points. Two of the most under-represented groups would see their chances of getting into higher tariff providers fall if exam-awarded points were used instead of predicted points. By around 5 per cent for POLAR Q1 and around 20 per cent for the Black ethnic group. The entry rate chances of men are similar under the two models.
Perhaps predicted grades do not hold overall detriment for equality but might still give small pockets of unfairness that hit some groups harder than others. One concern raised here is around the small number of applicants who are ‘under-predicted’. Specifically, whether some systemic unfairness in predicted grades means those from under-represented backgrounds are disproportionately likely to be in that group.
Analyses which claim to demonstrate this generally take a subset of students who end up with very high exam-awarded grades, and then look at their predicted grade background. If their predicted points are lower than the exam-awarded points, the student is said to be under-predicted. Typically, under-represented groups, like POLAR Q1, are found to have larger proportions of high-exam-grade students who are from low-predicted-grade backgrounds (under-predicted) than over-represented groups (like Q5). This drives the conclusion that predicted grades are differentially damaging to under-represented groups.
But these conclusions are very likely wrong. The reason is that the under- and over-represented groups have different predicted grade distributions which are not accounted for. The predicted point distribution for Q1 is shifted towards lower points relative to Q5 (Figure 5). So, for a grouping of high exam-awarded points there will be a greater share of Q1 applicants who can potentially get there by under-prediction than there is for Q5 applicants. For example, up to 55 per cent of Q1 applicants could be under-predicted if they obtained 14 points (ABB), whereas only a maximum of 35 per cent could be under-predicted from Q5 (Figure 6).
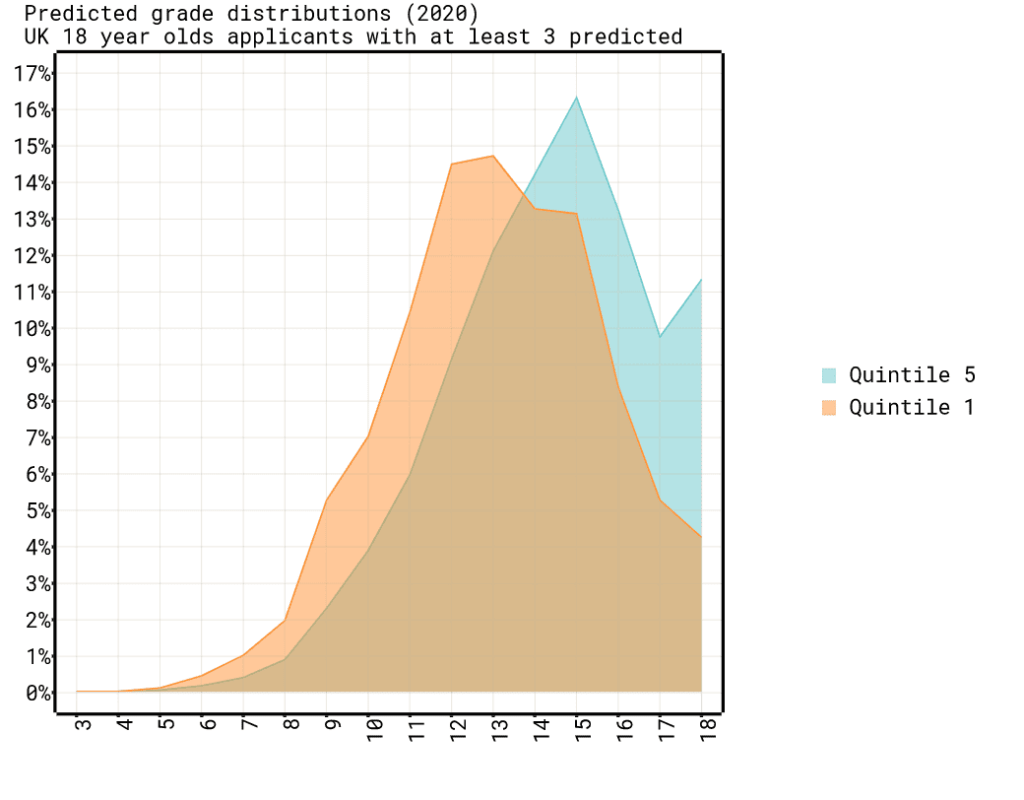
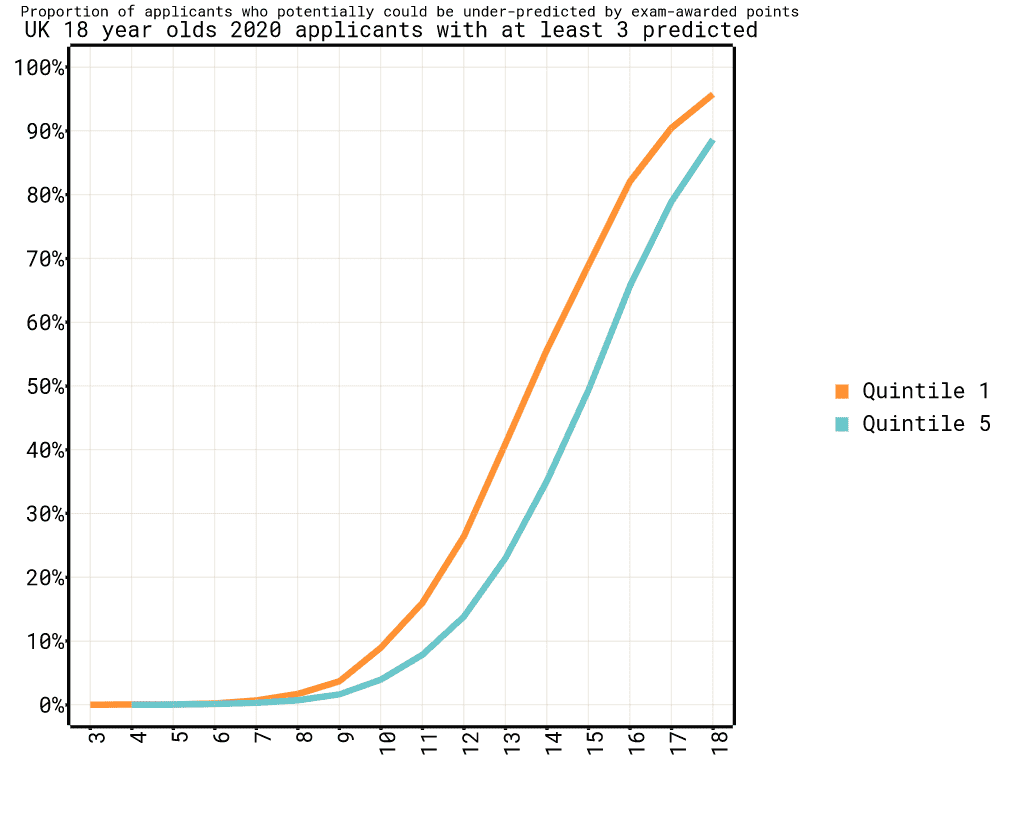
With these distributions, and the inherent random noise in exam results, when looking at just high-exam-grade students it is inevitable that more of the Q1 group will have got there through under-prediction. It is simply reflecting that there are more Q1 students with lower predicted points than Q5. This will be the case even if predicted grades have exactly the same relationship to exam-awarded grades for every group. That is, they are fair in that respect.
In practice the actual distribution of predicted grades near to the high-grade threshold and the assumed exam variability drive the patterns. Simulations of this indicate you would generally expect to see 40 to 80 per cent higher levels of ‘under-prediction’ for Q1 compared to Q5 among those with higher exam-awarded points. Such results say nothing about the fairness of predicted grades.
All of these equality analyses are approximations in one way or another. But the data do not provide any reason to suppose the use of predicted grades in the admissions system disadvantages under-represented groups. The opposite is more likely to be the case for the most under-represented group, POLAR Q1.
Predicted grades and admissions
If you view predicted grades as an estimate of how well someone might realistically do, and recognise that exam-awarded grades themselves have random noise, then there is no accuracy reason not to use predicted grades in university admissions. Teachers are often implied to be incompetent or scheming when it comes to predicted grades. The data says they do a difficult job well. Perhaps clarifying the nature of predicted grades by expanding the current single value to a likely upper and lower level of attainment would help this be more widely understood.
Omitting predicted grades from admissions would result in a poorer matching of potential to places. It would reduce the amount of measurement information about the underlying potential-to-flourish that universities are really looking for, and so increase the influence of random noise in exam results.
The belief that predicted grades harm equality is not supported by the data. The pattern is mixed across under-represented groups, but overall predicted grades are probably more an aid than a hinderance. Many obstacles stand in the way of under-represented groups getting to more selective universities, but the use of predicted grades in the admissions system is not one of them.
More widely, predicted grades enable an admissions system that affords more time for decision making and provides structure and security to the process. They also support an orderly and managed process from the university perspective, maximising intakes and letting students commence their studies without undue (and unfunded) delay. It seems reasonable that all these properties are particularly helpful to those from backgrounds with less familiarity with higher education as well as fewer resources. We would not really know until the system was gone. Policymakers who plan to take this risk on the basis of failings in predicted grades should take care the problems they want to solve are in fact real.
*These differences are influenced by a complex series of factors, including attainment distributions and application choices, beyond the scope of this note but the general pattern of elevated predicted grades for POLAR Q1 and the Black ethnic group holds in more detailed analysis (for example, https://www.ucas.com/file/71796/download?token=D4uuSzur).
Comments
Steve McArdle says:
The claim that high potential but disadvantaged applicants are more likely to be underpredicted is not quite what it seems. It might be better to say that “of the small group of disadvantaged applicants who attain highly at A level there appears to be an issue of underprediction.” It looks at the picture oddly by only sampling those who overcame their disadvantage, or to look at it another way it accepts A level results as a measure of potential.
Reply
Pete says:
Really good analysis.
One dimension that is missing is how universities utilise predicted grades. The conclusions of the analysis that post-qualification admissions are likely counter-productive is driven by an assumption that universities take predicted grades at face value and e.g. assume that a candidate within the top 10% of the predicted A-level distribution will be within the top 10% of the actual A-level distribution. This is incorrect.
Universities know A-level predictions are unreliable and so give high weight to GCSE grades to verify A-level predictions, use statistical discrimination – someone from an advantaged background from a private or grammar school who is predicted high A-level grades is statistically far more likely to achieve them than a disadvantaged student from a comprehensive or FE college – and give high rate to other factors they take as indications of likely A-level performance.
There is also individual unfairness – some schools and teachers are less likely to over-predict than others meaning that their students are disadvantaged.
I think that resolving this requires either some form of post-qualification admissions or some form of external exam to improve prediction quality like modular A-levels used to provide. I definitely would not have got to the university I ended up at in the current system as I would not have had an excellent set of module results to counterbalance my relatively weak GCSE results, which made my predicted grades a lot higher than they would otherwise have been and gave them added credibility thanks to being able to point to actual external examination results, and encouraged me to be a lot more ambitious in my university applications than I would otherwise have been.
Reply
Gavin Dodsworth says:
Genuinely interesting and one of those blogs that makes you think because it’s counter-intuitive.
Thanks
Reply
Jane Artess says:
How interesting. Thank you Mark.
Reply
Add comment