Key Facts and Figures about the Graduate Technical workforce
Midlands Innovation is a strategic research partnership of eight research intensive universities in the Midlands. Funding was awarded by Research England in 2020 for ‘TALENT’ – a transformation programme to advance status and opportunity for technical skills, roles and careers. The TALENT Commission report was published in 2022.
HEPI is running a series of blogs with Midlands Innovation championing the role of technicians in higher education and research. In this post, Dr Kostas Kollydas and Professor Anne Green from City-REDI/ WMREDI, Birmingham Business School, University of Birmingham, explore the demographics of the UK’s graduate technical workforce and the wider EDI challenges the workforce faces.
Exploring the demographic characteristics of technical workers who hold a degree-level qualification, in line with the data sourced by the TALENT Commission, helps us identify wider issues related to equality, diversity and inclusion (EDI) in the technical workforce.
The HESA Graduate Outcomes Survey (GOS) provides comprehensive information about the academic background and employment destinations of graduates who chose to complete the GOS 15 months after completing their studies.
Recent data from the 2017/18 and 2018/19 academic years indicate that 4.8 per cent of all employed graduates who lived in the UK before enrolling in higher education held technical jobs.
As the figure below illustrates, there are significant gender disparities in the distribution of technical graduate workers across occupations. Specifically, the proportion of men in the three most prevalent groups of the technical workforce, ‘science, engineering and production technicians’, ‘IT technicians’ and ‘architectural technicians’, is much higher than that of women (5.0, 13.3, and 6.3 percentage points, respectively). In contrast, the share of ‘health associate professionals’, ‘design occupations’, and ‘animal care and control services’ is approximately three times larger among women than men.
Distribution (%) of the graduate technical workforce by occupation group and gender
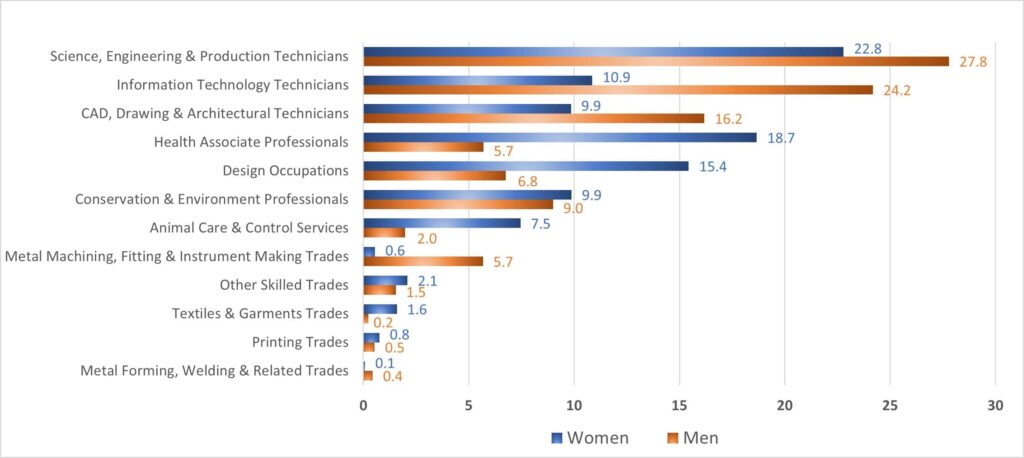
Note: Following the TALENT Commission report, the technical workforce is defined based on twelve three-digit codes of the Standard Occupational Classification (2020).
The table reveals that the technical workforce is less diverse than the broader labour force of recent graduates, particularly in terms of gender and ethnicity. Women represent 52.3 per cent of university-educated technical workers, which is significantly lower than the share observed in other occupations (59.8 per cent).
Similarly, Black, Indian, Pakistani and Bangladeshi ethnic minorities are underrepresented in the technical workforce. For instance, Black graduates make up only 4.7 per cent of the total number of technicians, which is lower than their proportional representation in other professions (6.3 per cent).
On the other hand, a greater share of people with a known disability (16.3 per cent) participates in the technical workforce than in the broader labour force of graduates (14.8 per cent).
Technical graduates who took part in the national GOS survey have a younger age profile, 83.4 per cent of technicians in our sample are under 30 years old, compared to 76.3 per cent of the rest of the workforce. (However, it is worth recognising that this would likely be the case, given that the majority of the GOS demographic are likely to be within the under-30 age bracket as recent graduates.) This may also partly explain the substantial pay differences between these two groups, with technicians earning an average of £4,000 less annually than others (£24,300 versus £28,200).
Nonetheless, the lower salaries offered to technicians in certain sectors should, at least partially, influence their career pathways and likely drive their transition to higher-paying industries.
With respect to other characteristics, technical workers are more likely than others to have studied Science, Technology, Engineering, and Mathematics (STEM) subjects (66.8 per cent); to have graduated from a post-1992 university (55.3 per cent); to hold ‘other undergraduate’ qualifications, such as Higher National Diplomas/ Certificates, professional qualifications and foundations degrees (14.8 per cent); to be employed in industries related to ‘professional/ scientific/ technical and financial activities’ (31 per cent); and to work in the South East and East of England (20.6 per cent). On the contrary, the percentage of technicians with doctorate-level degrees is half that of the non-technical labour force (1.7 per cent versus 3.7 per cent).
Within the higher education sector specifically, we know that most technicians hold a qualification at either undergraduate, higher degree or doctorate level, with 11 per cent of the total higher education technical workforce holding a PhD.
What does this exploration of data tell us and why does it matter? The GOS data identifies similar trends to the TALENT Commission, specifically in relation to EDI challenges. This has been recognised nationally and the report recommends ‘employers of technical staff, funding bodies and learned societies should undertake targeted and specific action to address the EDI challenges facing the technical community’.
Therefore, businesses and organisations in technical-related sectors should encourage inclusive recruitment practices and flexible work patterns. Moreover, the report proposes that outreach and policy engagement initiatives pertaining to technical occupations in schools and postsecondary education providers would raise the visibility of technical employment choices among young individuals.
A better understanding of the demand for technical skills and broadening of career pathways, and possibly a revision to qualification programmes that provide these skills and pathways into technical occupations, could result from stronger collaborations between education and training institutions and businesses engaged in technical activities. The future technical workforce could be strengthened by universities, research institutions, further education providers and industry working in partnership to ensure the provision of training and career development. This is a real opportunity to be harnessed.
Average characteristics of graduate workers amongst respondents to the Graduate Outcomes Survey 2017/18 and 2018/19 (technicians versus other workers)
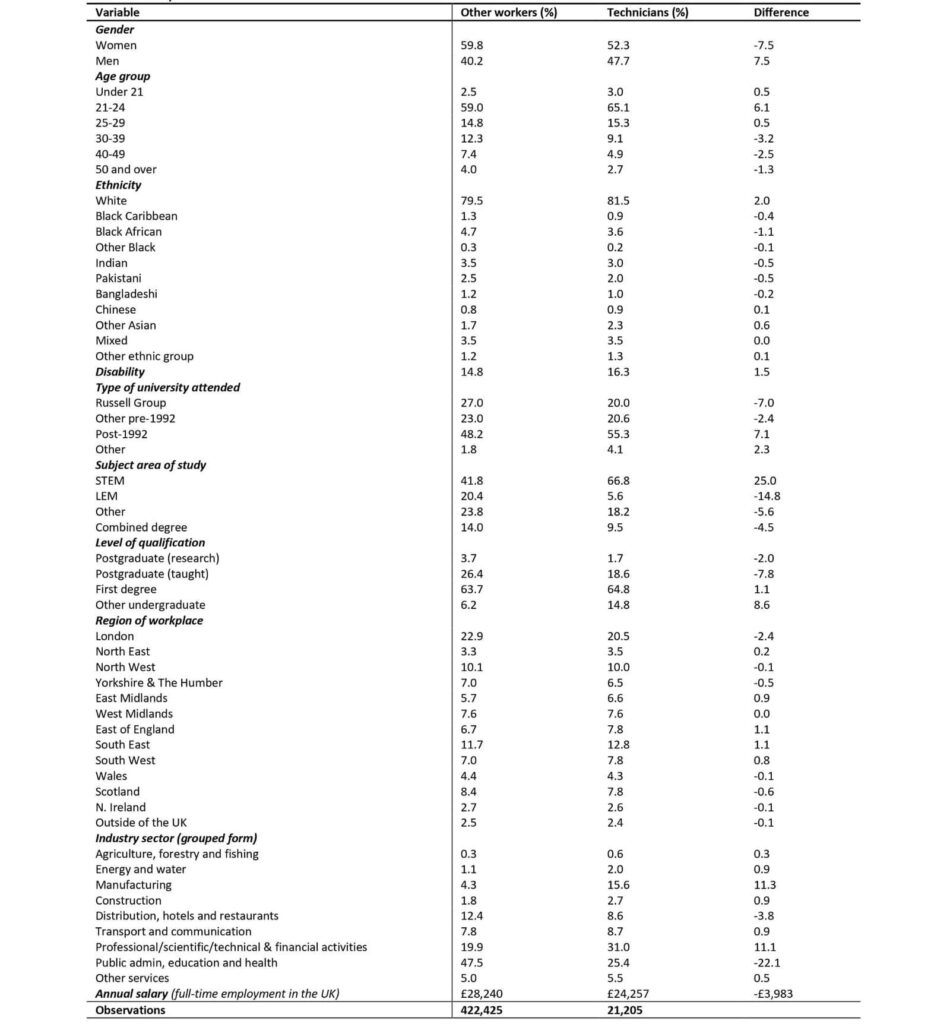
Note: STEM subjects comprise ‘Physical Sciences’, ‘Mathematical Sciences’, ‘Computer Science’, ‘Biological Sciences’, ‘Veterinary Science’, ‘Engineering and Technology’, ‘Agriculture and Related Subjects’ and ‘Architecture, Building and Planning’. LEM (Law, Economics and Management) subjects refer to ‘Law’, ‘Business and Administrative Studies’ and ‘Social Studies’. Other subjects include ‘Mass Communications and Documentation’, ‘Languages’, ‘Historical and Philosophical Studies’, “Creative Arts and Design’ and ‘Education’. The ‘combined’ subjects relate to joint degrees in more than one subject code (e.g., ‘BSc in Economics and Mathematics’).
Explore our blogs on technical talent:
- Helen Turner, ‘Championing the Role of Technicians’, HEPI blog, 21 September 2022.
- Jiteen Ahmed, ‘Just a technician?’ Not any more! Why it’s a great time to be a technician in higher education and research’, HEPI blog, 28 September 2022.
- Sam Kingman, ‘Empowering technicians: our journey’, HEPI blog, 5 October 2022.
- Richard Taylor and Julie Turner, ‘Engineering technical roles fit for the future’, HEPI blog, 12 October 2022.
- Jane Hubble, ‘How universities can step up to support the technical workforce’, HEPI blog, 19 October 2022.
- Trevor McMillian, ‘Delivering the Future: How universities can leverage technical expertise to fuel innovation’, HEPI blog, 26 October 2022.


Comments
Add comment