2023 English Social Mobility Index
- The annual LSBU English Social Mobility Index is published each year by the Higher Education Policy Institute and measures the social mobility of graduates. In 2023, there have been improvements to the methodology.
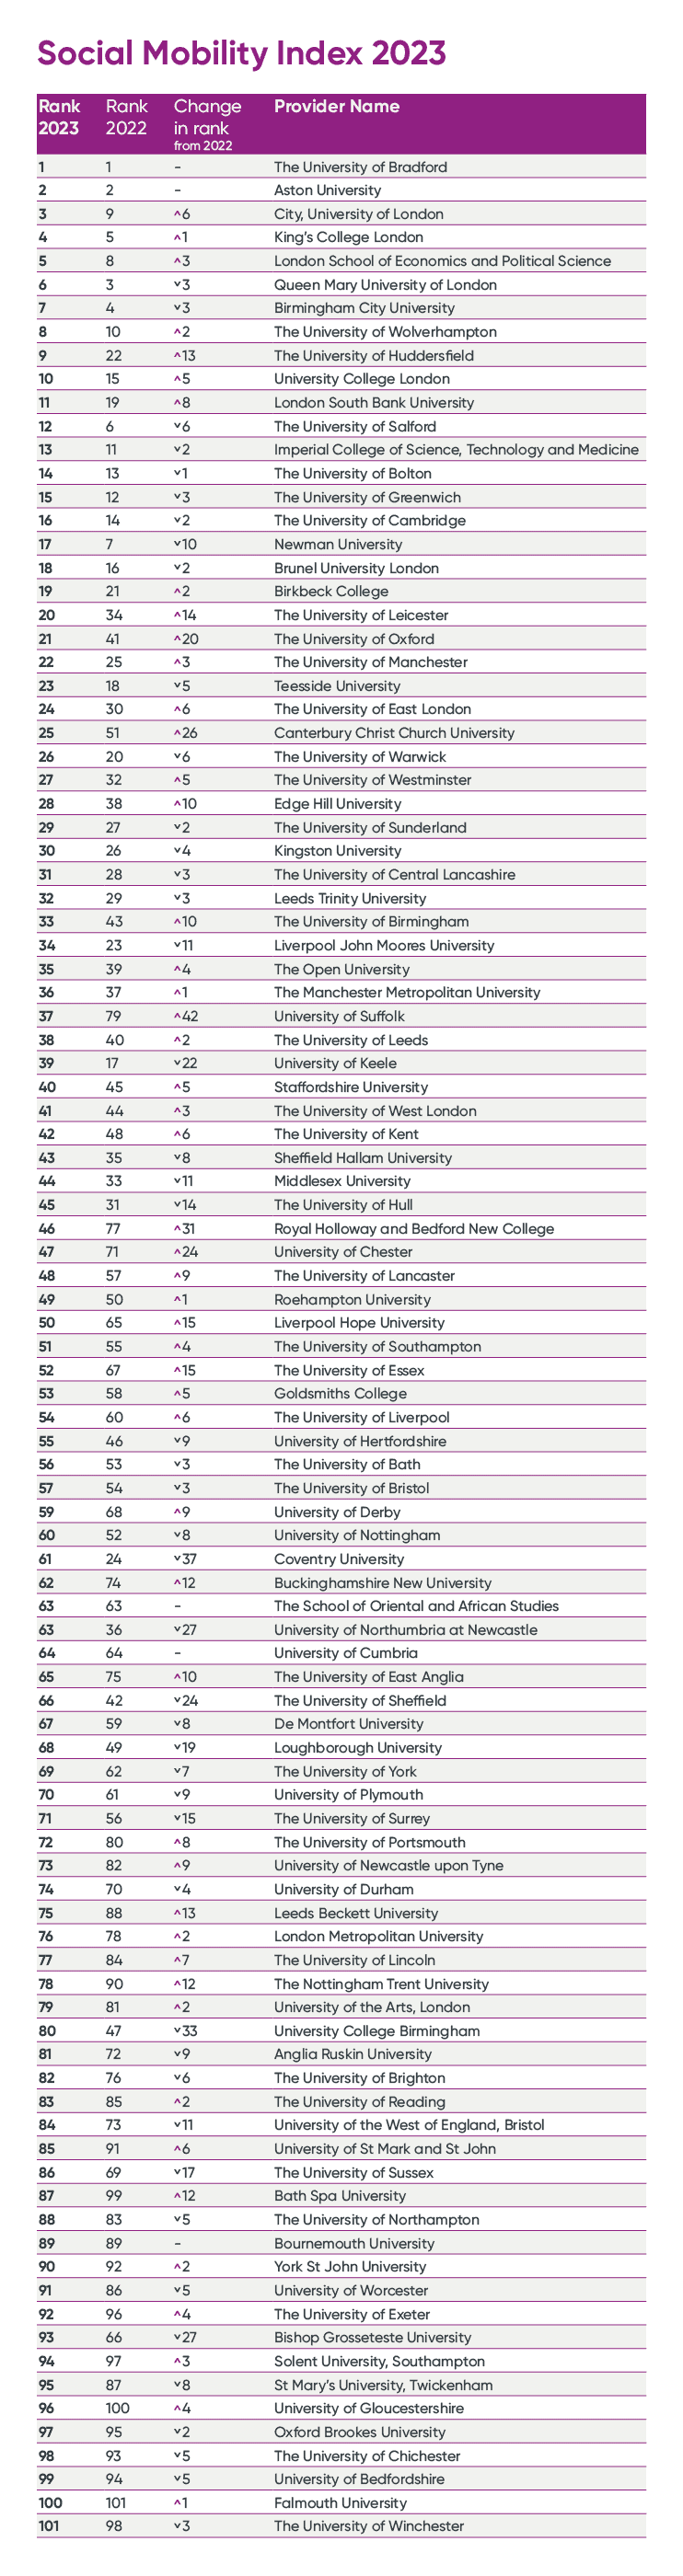
- The University of Bradford, Aston University and City, University of London take the top three places, followed by three Russell Group universities (KCL, the LSE and QMUL) and three post-1992 universities (Birmingham City, Wolverhampton and Huddersfield).
The English Social Mobility Index, which is compiled by London South Bank University (LSBU) and published by the Higher Education Policy Institute (HEPI), compares the performance of individual English higher education providers.
The Index measures the social distance travelled by graduates from each institution as well as the proportion of graduates so transported. It combines access, continuation and outcomes measures for undergraduates for all modes of study (except apprenticeships).
In 2023, the results show:
- Bradford (1), Aston (2) and City, University of London (3) perform best – these are all former Colleges of Advanced Technology (which became universities almost sixty years ago on the back of the Robbins Report of October 1963);
- King’s College London (4), the LSE (5) and Queen Mary University of London (6), which are all members of the Russell Group, come next in positions 4, 5 and 6; and
- Birmingham City (7), Wolverhampton (8) and Huddersfield (9), three post-1992 universities and former polytechnics are just behind, with another Russell Group University, UCL (10), taking the final spot.
The Index was established in 2021 but there have been improvements each year since. In 2023, the changes include:
- The entire Index is being published for the first time, rather than only the top 20.As we received a large number of requests for the full rankings by unlisted universities when the 2022 Index was issued, it seems appropriate to publish the full table for English universities registered with the Office for Students (excluding specialist institutions) for the first time.
- The publication date has been moved from the spring to the autumn, coming in line with other university league tables. This has, crucially, allowed the inclusion of more up-to-date information. Last year, the Index used data from 2019/20 but this year’s Index uses data from 2021/22, including the most recent Student Outcome and Experience indicators from the Office for Students, which were published in July.
- Apprentices have been removed from the Index. The Student Outcome and Experience indicators for apprenticeship students are now reported separately by the Office for Students (having previously been grouped together with full-time students). Incorporating the numbers is not possible because the data for small populations have been suppressed.
These improvements mean caution is needed when making direct year-on-year comparisons. While last year’s rankings are included in the published table, we advise against drawing too many conclusions when comparing last year’s results to this year’s. Despite the changes, both the University of Bradford and Aston University remain in first and second place respectively.
Further information on the methodology is provided below. A full explanation of the Survey is provided in the full-length report produced when the Index began in 2021, which is available here. Last year’s results are still available here.
Professor David Phoenix, Vice-Chancellor of LSBU, who compiles the Index for HEPI, said:
While numerous studies demonstrate that your personal circumstances and where you grow up have a strong bearing on your likelihood of achieving upward mobility, the 2023 Higher Education Social Mobility Index shows that your background does not have to determine your future.
Universities of all types, up and down the country, are countering expectation by consistently delivering improved economic prosperity for some of our most disadvantaged students.
The Government has repeatedly expressed its desire to tackle the regional inequalities holding communities back. One of the simplest ways they could do this is by celebrating the success of these institutions in breaking through international norms and ensuring that, in a climate of ever-dwindling resources, we don’t let a lack of finance inadvertently reinforce the glass ceiling and stifle this incredible pipeline of talent.
Professor Shirley Congdon, Vice-Chancellor of the University of Bradford, said:
I am delighted the University of Bradford has been ranked first nationally in the 2023 Social Mobility Index. This is testament to our core ambition to “make a difference” for our students, the city, and society in general.
At Bradford, the principle of equality of opportunity is at the heart of who we are, what we do, how and why we do it. We take tremendous pride in placing inclusion front and centre in our mission, vision, and values.
We are fiercely committed to widening access to higher education through our approach to recruitment and admissions.
Professor Aleks Subic, Vice-Chancellor and Chief Executive of Aston University, said:
I am delighted but not surprised that Aston University has, once again, ranked second in England in this important Social Mobility Index.
We have proved that it is possible to be an inclusive university which delivers impressive graduate outcomes, regardless of a student’s starting point or social capital.
As laid out in our Aston 2030 Strategy, by preparing students from all backgrounds for high-value careers in a changing and challenging world, we will deliver transformational social mobility and ensure our students, no matter their background, are ready for work and life.
Dr Diana Beech, Chief Executive of London Higher, said:
I am incredibly proud to see London universities so strongly represented at the top of the 2023 English Social Mobility Index, with London institutions making up half of the top 10 and, indeed, half of the top 20.
Despite operating in a region with the highest wealth inequalities in England, and in areas with very high levels of deprivation, London’s higher education institutions have proved themselves once again as remarkable engines of opportunity, taking in relatively high rates of disadvantaged pupils and preparing them well to secure fulfilling and well-paid careers. Their placement at the top of the table is a real testament to their achievements.
Nick Hillman, Director of the Higher Education Policy Institute (HEPI):
The Social Mobility Index is now in its third year and it has rapidly become one of the most impactful things HEPI does.
League tables are controversial and have pros and cons but they are not going to disappear, so it is illuminating to think about different methodologies and to measure things typically excluded.
The fact that some relatively new and less prestigious institutions beat Oxbridge reminds us of the different contributions made by different institutions. Above all, the Index confirms our higher education sector has strength in breadth.
We hear common complaints that there are too many universities and too many students, but this Index provides yet more evidence that higher education institutions of all types transform people’s lives.
- For methodological queries, please email [email protected].
- Logos for the Index, the Top 10 and the Top 20 are available. Please contact [email protected] for a copy.
2023 Social Mobility Index Methodology
The English Higher Education Social Mobility Index (SMI) ranks English universities registered with the Office for Students (excluding specialist institutions) by their contribution to social mobility, based on the social distance travelled by their graduates.
It combines measures of a) access, b) continuation and c) graduate outcomes for undergraduate students. All modes of study are included, although apprenticeship students are necessarily excluded due to a shortage of comparable data.
The following measures are included and reported separately for each year, mode and Index of Multiple Deprivation (IMD) quintiles 1 and 2:
Access
Access is measured by the proportion of new entrants from Index of Multiple Deprivation Quintiles 1 and 2 at each provider.
Continuation
Continuation is measured by the Office for Students’ Continuation indicator, which records the percentage of first-year students who complete their course or remain in UK higher education for 12 months (full-time students) or 24 months (part-time students) after starting their course.
Note: Because the Office for Students’ Access and Participation dataset splits all data by mode (FT and PT), the data inputs are pulled into the model by mode and then pro-rated by the FT/PT headcount split.
Graduate Outcomes
Graduate Outcomes are measured by two components which are given equal weight and combined:
- Graduate Outcomes as measured by the percentage of graduates with ‘Positive Outcomes’ in the Office for Students’ Proceed definition. The Proceed Definition counts highly skilled employment, any further study and other activities (except ‘Doing something else’) as positive outcomes; and medium / low skilled employment and unemployment as negative outcomes.
- Median salaries as measured in the Graduate Outcomes survey.
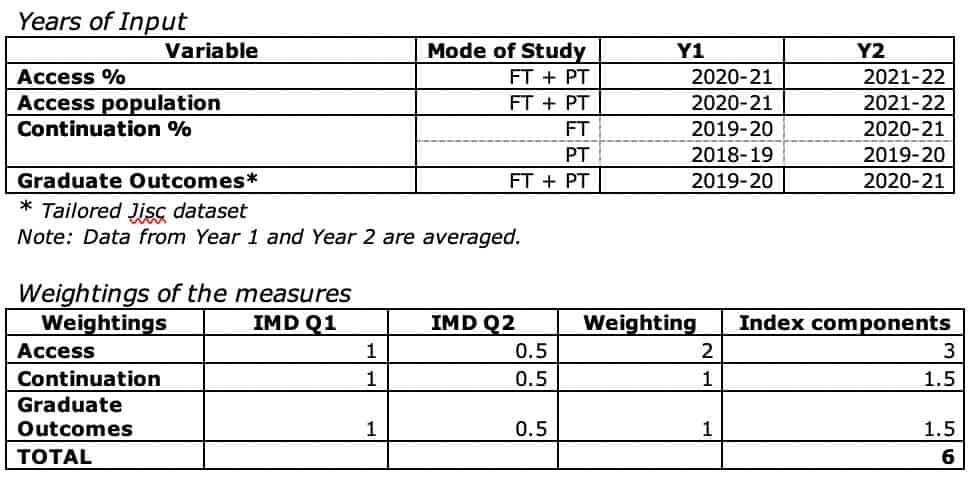
The double weighting of IMD1 over IMD2 recognises the greater impact on upward social mobility achieved by successfully delivering outcomes to students from IMD1 postcodes.
Access, in turn, is weighted the highest at x2 because social mobility depends on those learners from disadvantaged backgrounds successfully entering university to begin with.
The two outcomes stages (Continuation and Graduate Outcomes) are weighted at x1 each.


Comments
A F Tchana says:
Bradford University is a small country in the UK where we are all ONE person regardless of your role or status. Everybody seems to feel at home with brothers and sister coming from all over the world.
Reply
Robert Clarkson says:
I graduated from Bradford University in1974 with a degree in Ophthalmic Optics which led to a fantastic career as an Optometrist . When I look back at my three years studying and living in Bradford I realise how much it contributed to my life in a very positive way . The opportunity to meet other students from many diverse social , ethnic , political and religious backgrounds stands out .
Based on my own experience of Bradford University, I would highly recommend applying.
I
Reply
Brian says:
How do you separate the impact of the type of degrees that are offered from that of the institution attended. I suspect the former has the biggest impact. Places like City University for example don’t waste too many students prospects by offering degrees in Tree Climbing & Animal Noises !
Reply
Paul Ho says:
Can we see the underlying data that produces this ranking? All I can see is a blurry table of names.
Reply
Andrew H says:
This is an interesting attempt at a social mobility index, but there are some serious issues that need addressing. First, it takes no account of subjects so it is hardly surprising that the LSE does well. Second, the LEO data inevitably only includes students with a job. It ignores those going on to postgraduate study, but more seriously ignores the unemployed. A university with lots of IMD Q1 and Q2 students who all ended up unemployed while the Q3-5 students got stellar jobs would be reducing social mobility and yet could top the table.
Reply
Add comment