A place for data: Illustrating how the higher education sector may support more inclusive growth
- This HEPI blog was kindly authored by Tej Nathwani, Principal Researcher (Economist) at HESA, the Higher Education Statistics Agency.
Introduction and main findings
A country characterised by low growth and entrenched inequality. This is how a recent report by the Resolution Foundation summarised the UK. It’s for this reason that increasing prosperity in an equitable manner is a key challenge facing policymakers across the nation in upcoming years. For the sector, the question this has raised is;
How might (higher) education play a role in helping to tackle the twin challenge of poor productivity and high inequality?
Today, we add our contribution to this area of discussion by releasing the findings from an empirical analysis examining the association between education provision, the skill level of the local population and productivity.
The key take-away message from our study is as follows. Among the 374 local authorities/council areas/local government districts across the UK, there are a cluster of 38 localities – often exhibiting a mining, manufacturing or industrial legacy – which have both low productivity (on average) and the smallest proportion of residents with Level 4 qualifications or above (this category would generally cover those with degrees, but will also often include individuals with sub-degree qualifications such as HNCs/HNDs). As well as a relatively low stock of skilled workers, these areas also tend to display a net outflow of graduates. School attainment is typically below the national average. Based on our own UK-wide area-based measure of deprivation, we find that 44% of vicinities within these 38 local authorities/council areas fall within the most deprived quintile.
Current data available to us suggests that these places are less likely to have higher education provision and hence are possible ‘cold spots’. The one caveat on our findings relating to provision is that we do not hold data on courses offered by further education colleges at the moment, though we are looking to ingest this information in the near future.
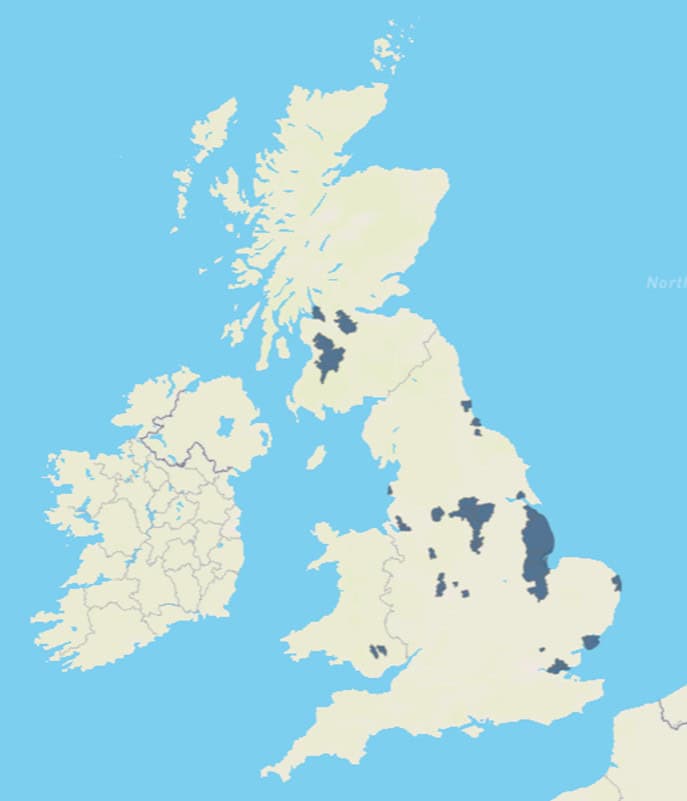
With education one of the factors that can help to increase productivity, these are therefore areas where raising both skills and school attainment could particularly help form part of the solution to boosting living standards. Below, we provide a static image of the locations of these 38 local authorities, with our insight providing readers with the option to explore an interactive map, alongside some key summary statistics on each local authority/council area.
Figure 1: The locations of the 38 local authorities with the lowest proportion of residents with Level 4 qualifications or above according to the 2011 Census
The approach
So, how did we reach these conclusions? Our starting point was feedback we received on our new graduate mobility marker, where we had used local authority (council areas in Scotland and local government districts in Northern Ireland) information for the first time when looking at location of domicile/work. However, we were still relying on region of study and this was identified as being something that would be helpful to disaggregate to a lower level of geography too. A by-product of starting to develop our marker further in this way is that we are able to derive a field that tells us the number of higher education providers in each local authority.
In recent years, the Office for National Statistics (ONS) have started to produce productivity estimates at the local authority level. Furthermore, the Census provides us with data on the qualifications of residents at a particular point in time. With Scotland due to release its 2022 results later this year, we have drawn upon 2011 data for this work (though evidence suggests that graduate shares in areas do not change greatly over time). The other advantage of using Census 2011 is that this data was used by the ONS to produce area classifications, which allowed us to better understand the characteristics of those localities with low productivity and qualifications. Finally, to examine the movement of skills (alongside the stock), we were able to make use of the Graduate Outcomes survey to look at whether an area is experiencing a net inflow or outflow of graduates.
The analysis
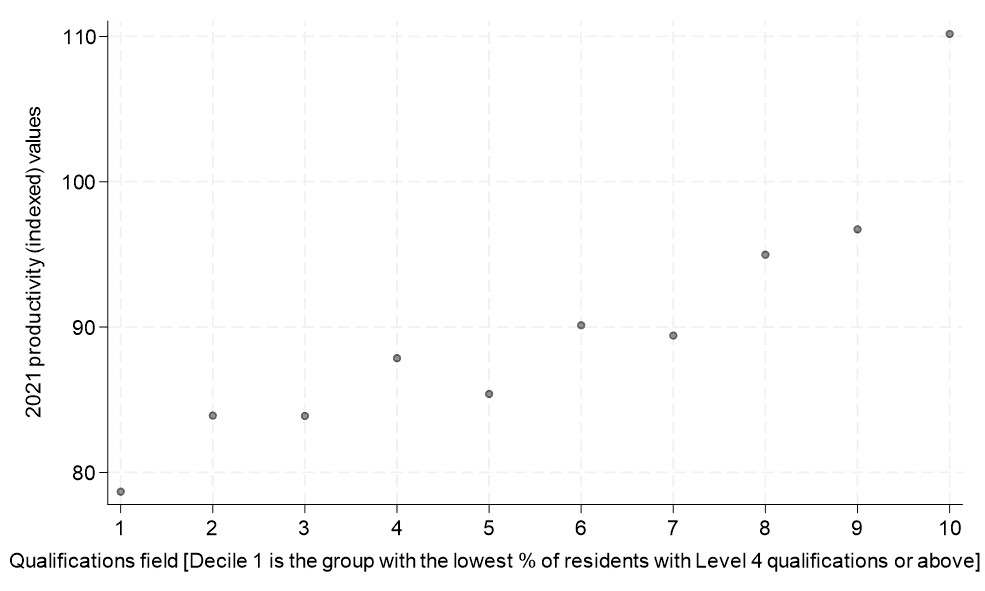
Our method for obtaining the list of 38 local authorities was to firstly split local authorities into ten groups based on the proportion of residents with Level 4 qualifications or above. Hence, decile 1 contained the areas which had the smallest percentage of the population stating they had Level 4 qualifications or above, with decile 10 representing localities with the highest proportions. We then plotted the median 2021 productivity in each of these ten clusters, which resulted in the figure below. The productivity values here are indexed, with 100 representing the UK average. An area with a figure of 75 is therefore 25% less productive when compared with the national average. At a time of tight fiscal budgets, policymakers face an environment of constrained choice. Hence, based on this chart, the areas that appear best to target in the first instance look to be in decile 1 and we therefore focused the rest of our investigation on this category.
Figure 2: The association between qualifications and productivity across UK local authorities
Only in five of the 38 local authorities (Blackpool, Harlow, Hull, Middlesborough and Stoke-on-Trent) did we observe a net inflow of graduates fifteen months after they had qualified. When we cross-tabulated the qualifications field (in decile format) and the number of providers in a local authority variable that we had created, we found that almost two-thirds of areas in decile 1 did not seem to have any provision. Among those that did, they were often served by a single establishment. Whilst we couldn’t ingest school attainment data directly into our dataset (for example, due to the differing systems across the four nations), where we could source relevant information, we found that the local authorities that emerge in the bottom decile are places where pupils attain below the national average. Hence, these are also localities that may benefit from widening participation activity designed to raise aspiration and school attainment.
Concluding remarks: Taking a more joined-up approach
How might widening participation activity in higher education help to ensure there is equal opportunity for all? What role can the sector play in boosting living standards in areas that have faced relative economic decline? These have often been questions that have been asked and tackled separately. The above exploration, however, aims to begin addressing these matters jointly.
Continuing with the joining up theme, in recent years, we have seen increased debate on both the HEPI website and the broader literature around the merits of creating a single tertiary system. From a data perspective, HESA have already begun the journey of attempting to create a single source of information on higher education provision across both further education colleges and universities. The value of taking such a pathway can be seen when considering one of the recommendations made by the Resolution Foundation on skills. In their report, they argue that the share of the population qualified at sub-degree level (e.g. with HNC/HND qualifications) is far below what it should be given the nature of our economy. Indeed, they call for wider provision and the formation of new providers to serve ‘cold-spots’ to help resolve this challenge. However, that raises the question of where exactly these ‘cold spots’ are. The ability to find answers to such matters and thereby enable better decision-making is one of the longer-term benefits that can stem from this unified data source that we are seeking to deliver.
Notes
You can find the full insight and accompanying data on the HESA website. Thoughts and comments on the piece are most welcome and can be sent to [email protected].
If you would like to be kept updated on HESA’s publication plans and latest research releases, please sign-up to our mailing list.


Comments
Add comment