2024 English Social Mobility Index
The English Social Mobility Index, which is compiled by London South Bank University (LSBU), has been published by the Higher Education Policy Institute (HEPI) since 2021. The University of Bradford, Aston University and The University of Wolverhampton have secured the top three places, followed by The University of Bolton, The University of Salford and Birmingham Newman University.
The annual LSBU English Social Mobility Index is published each year by the Higher Education Policy Institute and measures the social mobility of graduates. In 2024, there have been further improvements to the methodology.
The Index measures the social distance travelled by socio-economically disadvantaged graduates from each higher education institution in England as well as the proportion of graduates so transported. It combines access, continuation and outcomes measures for undergraduates for all modes of study (except apprenticeships).
Improvements have been made to the methodology of the index each year since its inception. In the 2024 iteration, graduate salaries have been weighted by region to account for salary differences across the country.
In 2024, the results show:
- Bradford (1) and Aston (2) perform best – maintaining their respective positions of first and second since the SMI’s launch. Both are former Colleges of Advanced Technology (CAT);
- Post 92 institutions, The University of Wolverhampton (3) and The University of Bolton (4), former CAT, The University of Salford (5) and former University College, Birmingham Newman University (6), come next in positions 3, 4, 5 and 6;
- The University of Huddersfield (7), Birmingham City University (8) both post 92 institutions come in 7 and 8 while London universities, City St George’s, University of London (9), and the London School of Economics and Political Science (10) complete the top 10.
- While London universities made up half of the top ten last year, only two institutions have been included in the 2024 iteration as the salary premium enjoyed by London-based graduates has been accounted for by regional weighting. Universities in the West Midlands, conversely, now make up four of the top ten.
- The number of Russell Group institutions in the top ten has also reduced from four to one.
The introduction of salary weighting means that some caution is needed when making direct year-on-year comparisons. Further information on the methodology is provided below. A full explanation of the Survey is provided in the full-length report produced when the Index began in 2021, which is available here. Last year’s results are still available here.
NB If looking at the results below on a small screen, like a mobile phone, they appear better in landscape mode as opposed to portrait mode.
The Secretary of State for Education, Bridget Phillipson, said:
Despite growing up in a deeply disadvantaged area I had the opportunity to go to university – but I was one of the lucky ones. Breaking the link between where a young person goes up, and the opportunities they have, is central to our mission.
Following the recent measures taken to stabilise universities, we will now demand more from the sector through far-reaching reform – including opening up access to working-class young people.
We are committed to restoring universities as engines of opportunity, growth and aspiration. We will fix the foundations of higher education to deliver change for students.
Professor David Phoenix, Vice-Chancellor of LSBU, who compiles the Index for HEPI, said:
The 2024 English Higher Education Social Mobility Index highlights once again that universities up and down the country are breaking down barriers to opportunity. The new Secretary of State for Education, Bridget Phillipson MP, has been clear that she expects higher education providers to play a stronger role in expanding and improving outcomes for disadvantaged students. I hope, therefore, that the Index provides a useful for tool for universities across the sector. Institutions making a strong impact on social mobility can use it to evidence their contribution while those universities that wish to increase their support for disadvantaged students can use it help identify good practice and to work out the most appropriate way of doing so in accordance with their institutional mission.
Richard Parker, Mayor of the West Midlands, said:
Having someone believe in me, gave me the confidence to go back to learning. And my time at university changed my life so I know how transformative education can be. Having four of our region’s universities ranked in the UK’s top 10 for social mobility highlights their role in creating opportunities and transforming young lives.
Through my Youth Plan, I’m committed to ensuring every young person in the West Midlands can access the skills and opportunities they need to succeed. Our universities are vital partners in helping to make that vision a reality.
University of Bradford Vice-Chancellor Professor Shirley Congdon said:
We have for many years put great emphasis on making the University of Bradford the place to be to make a difference. This is a core part of who we are and informs everything we do.
As we stated in our silver-award submission as part of the Teaching Excellence Framework in 2023, we are proud to be the university of and for Bradford. We are committed to transforming the lives of our students by removing barriers and reducing attainment gaps. This in turn elevates their families and whole communities, enabling regional business to thrive, and boosting the economy.
The latest Social Mobility Index is evidence that our vision and mission are working.
We will continue to strive for equality of access, opportunity and outcomes through targeted interventions such as those outlined in our Access and Participation Plan to ensure our students prosper from increased opportunities.
Professor Ebrahim Adia, Vice-Chancellor and Chief Executive of the University of Wolverhampton, said:
Our Strategy 2035 reaffirms our identity as a civic institution powered by our sense of place and connections to our local and global communities. It also commits us to undertaking a leading role in delivering a more inclusive, productive and sustainable society. As the University of Opportunity it is very encouraging to see our efforts and approach validated in this year’s publication of the HEPI Social Index where we have climbed a further 5 places in the ranking to 3rd in England. Working collaboratively with our partners and our communities we will continue the pursuit of delivering positive outcomes for all of our students, including those who are most disadvantaged.
Professor Aleks Subic, Vice-Chancellor and Chief Executive of Aston University said:
It is extremely rewarding to see Aston University ranked second in the English Social Mobility Index for the fourth year in a row, resulting from all the hard work and dedication of our staff and students. Inclusion is at the heart of Aston University’s 2030 strategy, and we take great pride in Aston being an institution that delivers strong graduate outcomes that transforms lives, regardless of our students’ starting points. We focus on individual learning journeys, personalised end-to-end support and preparation for life and work, ensuring all our students, irrespective of their background, can access and achieve successful careers.
- For methodological queries, please email [email protected].
- Logos for the Index, the Top 10 and the Top 20 are available. Please contact [email protected] for a copy.
2024 Social Mobility Index Methodology
The English Higher Education Social Mobility Index (SMI) ranks English universities registered with the Office for Students (excluding specialist institutions) by their contribution to social mobility, based on the social distance travelled by their graduates.
It combines measures of a) access, b) continuation and c) graduate outcomes for undergraduate students. All modes of study are included, although apprenticeship students are necessarily excluded due to a shortage of comparable data.
The following measures are included and reported separately for each year, mode and Index of Multiple Deprivation (IMD) quintiles 1 and 2:
Access
Access is measured by the proportion of new entrants from Index of Multiple Deprivation Quintiles 1 and 2 at each provider.
Continuation
Continuation is measured by theOffice for Students’ Continuation indicator, which records the percentage of first-year students who complete their course or remain in UK higher education for 12 months (full-time students) or 24 months (part-time students) after starting their course.
Note: Because the Office for Students’ Access and Participation dataset splits all data by mode (FT and PT), the data inputs are pulled into the model by mode and then pro-rated by the FT/PT headcount split.
Graduate Outcomes
Graduate Outcomes are measured by two components which are given equal weight and combined:
- Graduate Outcomesas measured by the percentage of graduates with ‘Positive Outcomes’ in the Office for Students’ Proceed definition. The Proceed Definition counts highly skilled employment, any further study and other activities (except ‘Doing something else’) as positive outcomes; and medium / low skilled employment and unemployment as negative outcomes.
- Median salaries as measured in the Graduate Outcomes survey, adjusted to account for wage variations across different regions of England.
Years of Input
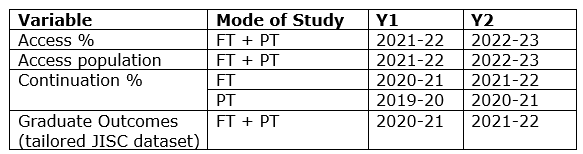
Note: Data from Year 1 and Year 2 is averaged
Weightings of the measures
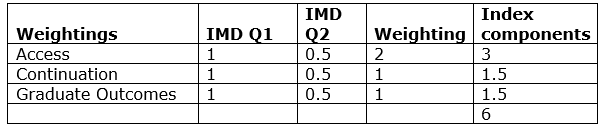
The double weighting of IMD1 over IMD2 recognises the greater impact on upward social mobility achieved by successfully delivering outcomes to students from IMD1 postcodes.
Access, in turn, is weighted the highest at x2 because social mobility depends on those learners from disadvantaged backgrounds successfully matriculating to university to begin with.
The two outcomes stages (Continuation and Graduate Outcomes) are weighted at x1 each.
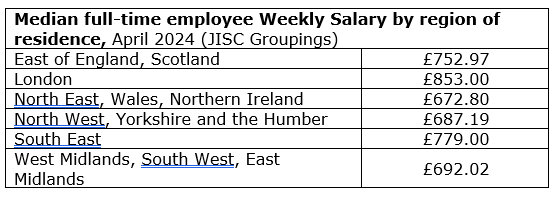
Salary Weighting
Salaries have been adjusted using median wages by region data from the ONS to mitigate against the distorting impact of variation in earnings by region – accounting for the salary premium enjoyed by graduates in regions such as London.
Using median weekly pay by region of residence for full-time employees (taken from the ONS Annual Survey for Hours and Earnings) and then averaging this into six graduate destination regional groupings provided by JISC in the GO dataset, the index applies a reduction to those salaries for the regions where the median wage is above the salaries of the region with the lowest median wage.


Comments
Pete says:
It is very challenging to understand the rationale for the rankings without publication of the full data the underpins the index, including the normalised scores for each metric and the index values for each constituent part of the index.
Several elements of the methodology – including the normalisation procedure used and how outcomes for part-time students have been compared to outcomes for full-time students – remain opaque both in the short summary here and in the full report published alongside the original index.
Reply
Add comment